










Swan’s Agentic Software Factory: Cygnet Evolved


How Swan built an agentic software factory that finds production bugs, reaches consensus on the fix, opens the PR, and proves it works before a human merges.
In this article
Last week, the total federal debt crossed $40 trillion. Headlines quoted Treasury Secretary Scott Bessent and showed charts. But $40 trillion is more useful as a map marker than as a milestone. It tells us where we stand. The full debt picture shows how we got here and where the path leads.
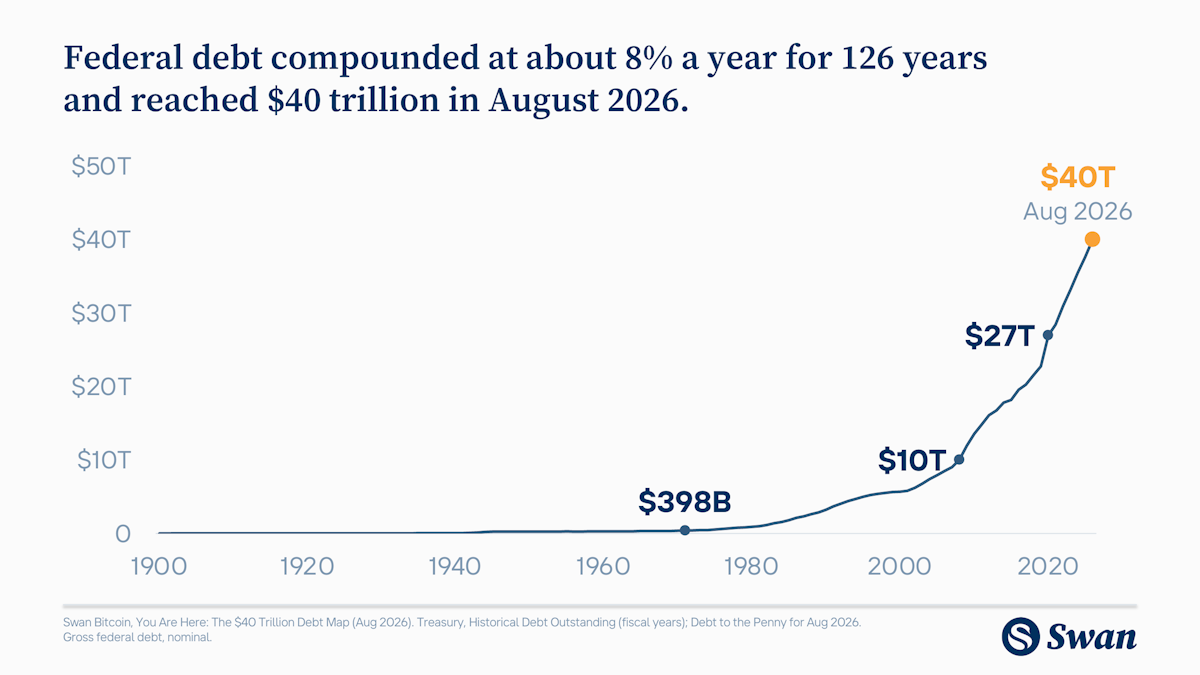
First, look at the past 126 years on one chart. The shape is a classic ‘hockey stick’.
In 1900, the federal government owed $2.1 billion. The First World War took it to $28 billion. The Second World War pushed it to $259 billion. Wars stepped the level up, and for a while, peacetime paid some of it back down. Then came 1971, the year the gold window closed, with the debt at $398 billion. $1 trillion by 1982. $10 trillion by 2008. $27 trillion by 2020. $40 trillion today. On a linear axis, the first seven decades barely register above the axis. It is roughly 8% growth compounded annually from 1900 to 2026. This is what compounding looks like once the constraint of a hard money gold standard is removed.
Big numbers lose their meaning; past a certain point, we can’t picture them. And the units themselves lose value as the supply of the money grows.
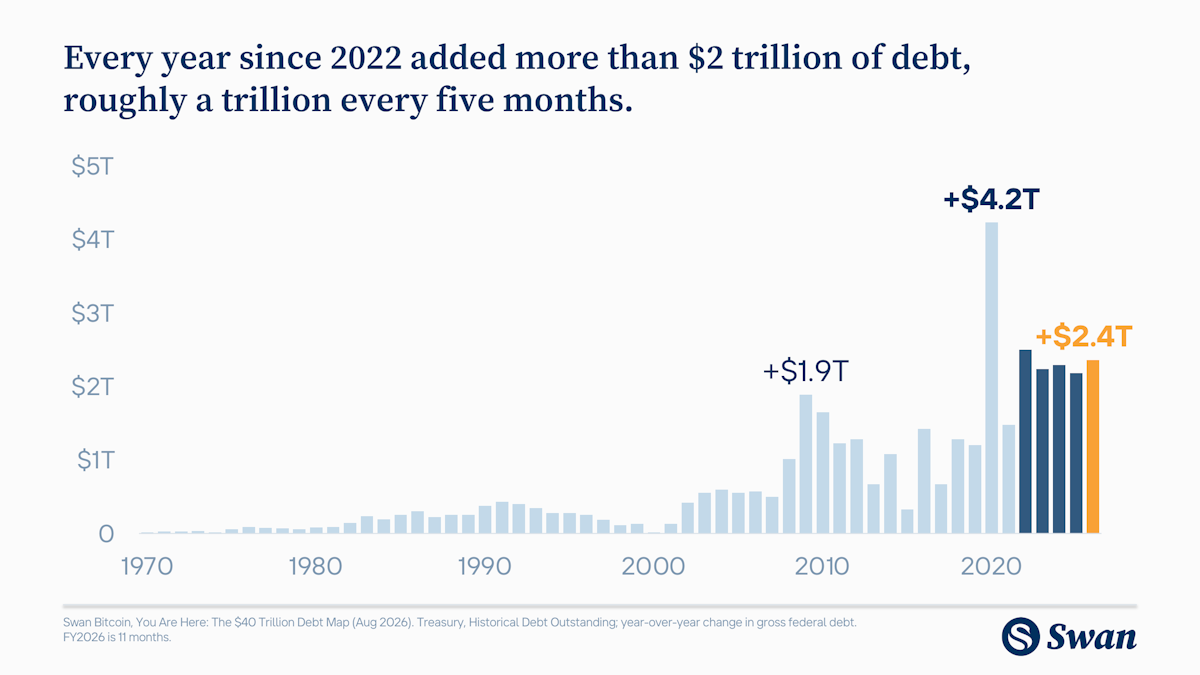
The speed of debt increase is also part of the story. The first trillion took 191 years to accumulate. The most recent trillion took 154 days. The annual increase shows the trend more clearly.
For eight decades, the annual change was a rounding error at this scale. WWI peaked at +$13 billion a year and WWII at +$64 billion. From 1920 to 1930, the debt fell eleven years running, the last sustained paydown in American history. The only declines since then occurred in 1947, 1948, 1951, 1956, and 1957.
The debt has now risen for 69 consecutive years, including straight through the surpluses of 1998 to 2001. Those four years retired about $450 billion owed to markets, and every dollar of it was replaced by new Treasury securities issued to the Social Security trust fund.
That is still debt. A bond held by a trust fund is a claim that is redeemed later with money borrowed from the public, which is what is happening now as those funds are drained. The best fiscal run in modern American history, four consecutive surpluses in a boom, did not reduce what the government owed by a single dollar.
The financial crisis added $1.9 trillion in 2009. COVID added $4.2 trillion in 2020, and then the increment never came back down. Every year since 2022 has added $2.2 to $2.5 trillion, approximately a trillion dollars every five months.
No federal administration since 1971 has ever reduced the debt. Pick your favorite (or least favorite), and the debt gets bigger. Why constrain spending when you can just print it?
The dollars themselves changed underneath the chart. A dollar today has roughly the purchasing power of 13 cents in 1971. So the honest reading is a double debasement. The government owes vastly more units, and each unit is worth vastly less. Nominal is the point. These are the actual dollars that were borrowed, and the actual dollars that must be created to service and roll them.
Is a dollar really a dollar if it’s not worth what it was? We use the same word, but it doesn’t mean the same thing.
Look at the expressions handed down from when a penny held value.
“A penny for your thoughts.” — John Heywood’s 1546 collection of English proverbs
“A penny saved is a penny earned.” — Thomas Fuller, 1661
“One cent saved here and another saved there will eventually amount to a considerable sum.” — 1889, Georgia
“Save the Pennies.” — 1918, Texas
The penny has gone from a meaningful unit of value and a fixture of popular expression to a coin the Mint no longer produces. Does every price eventually round to a quarter, and then a dollar?
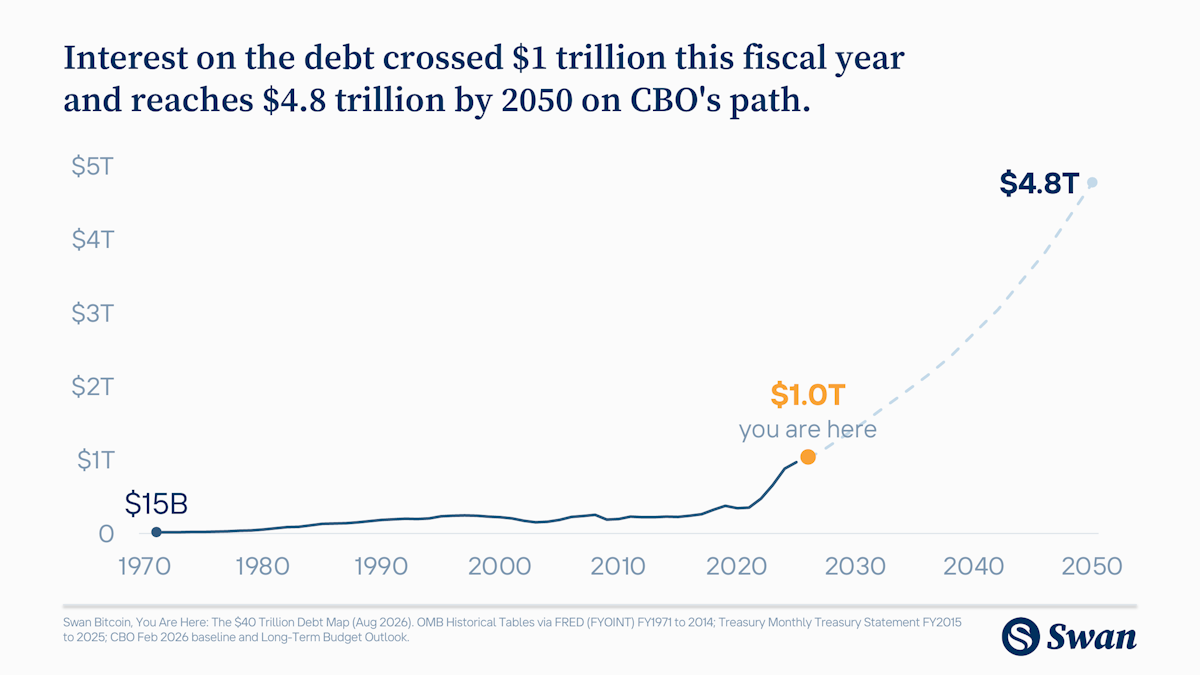
The carrying cost followed the same curve as the debt levels, just later. In fiscal 1971, the interest bill was $15 billion. It stayed below $400 billion every year through 2019. Then it crossed $500 billion in 2023, and it will cross $1 trillion this fiscal year, more than the country spends on national defense (and roughly the total amount of debt added in 2008, just 18 years earlier). In 1991, net interest consumed 3.2% of GDP, a record that stood for 34 years until fiscal 2025 broke it. It is likely to be broken again every year from now on.
Now back to that red marker on the map.
The path to today was exponential. How might the future look?
The Congressional Budget Office (CBO), Congress’s nonpartisan budget agency, projects interest costs reaching $4.8 trillion by 2050, 6.1% of GDP. An ever-larger share of each year’s new borrowing exists to pay interest on the old borrowing. History says it will continue. And if so, it compounds on itself.
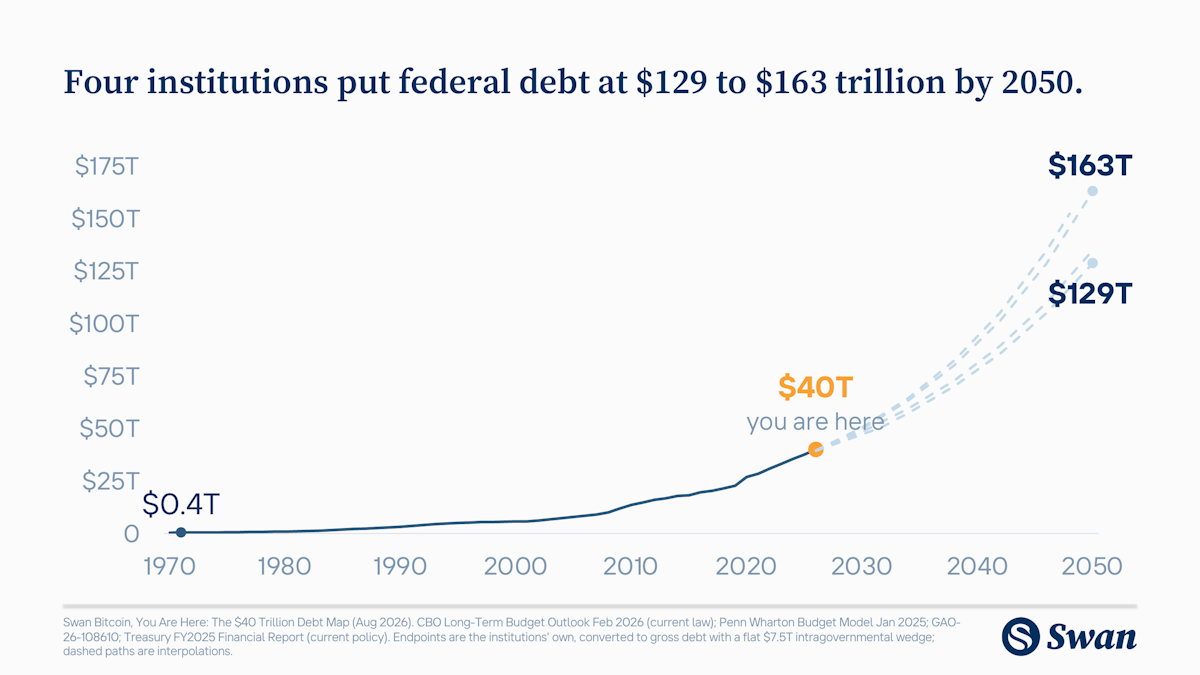
Four institutions have published debt paths to 2050. CBO’s current-law baseline puts total federal debt at roughly $129 trillion. Penn Wharton’s model says $135 trillion. Treasury’s own long-term projection and GAO’s simulation, which assume today’s policies continue, land near $152 trillion and $163 trillion, respectively.
These projections originate directly from the federal government’s budget group (CBO), its accountant (Treasury), its auditor (GAO), and the University of Pennsylvania. They agree on the ballpark and the hockey stick, and disagree only on the steepness.
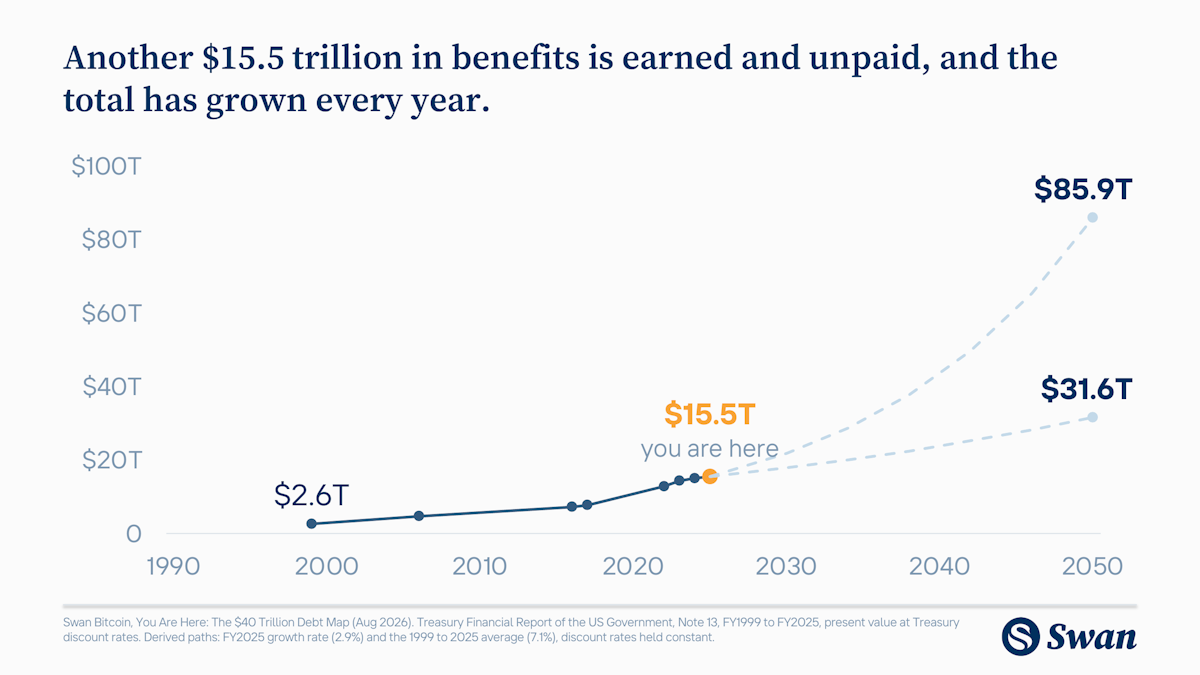
The Treasury’s balance sheet reports $15.5 trillion in federal employee and veteran benefits already earned but not yet paid. Add that accrued liability to $40 trillion of gross debt, and the broader federal obligation is about $55 trillion. It is not all debt today, but it is money the government has already promised.
The benefit payments are already reflected in the four projections. Because the budget remains in deficit, those payments add to borrowing as they come due. The $15.5 trillion, therefore, belongs alongside current debt when measuring the broader federal obligation.
And it keeps growing. After accounting for all benefits paid, the liability still rose by $439 billion last year, as it has every year on record. If it grows at last year’s 2.9% rate, the slowest in the series, and discount rates remain unchanged, it reaches $31.6 trillion by 2050. At the 7.1% annual rate it has averaged since 1999, it reaches $85.9 trillion. That is a range of more than $50 trillion.
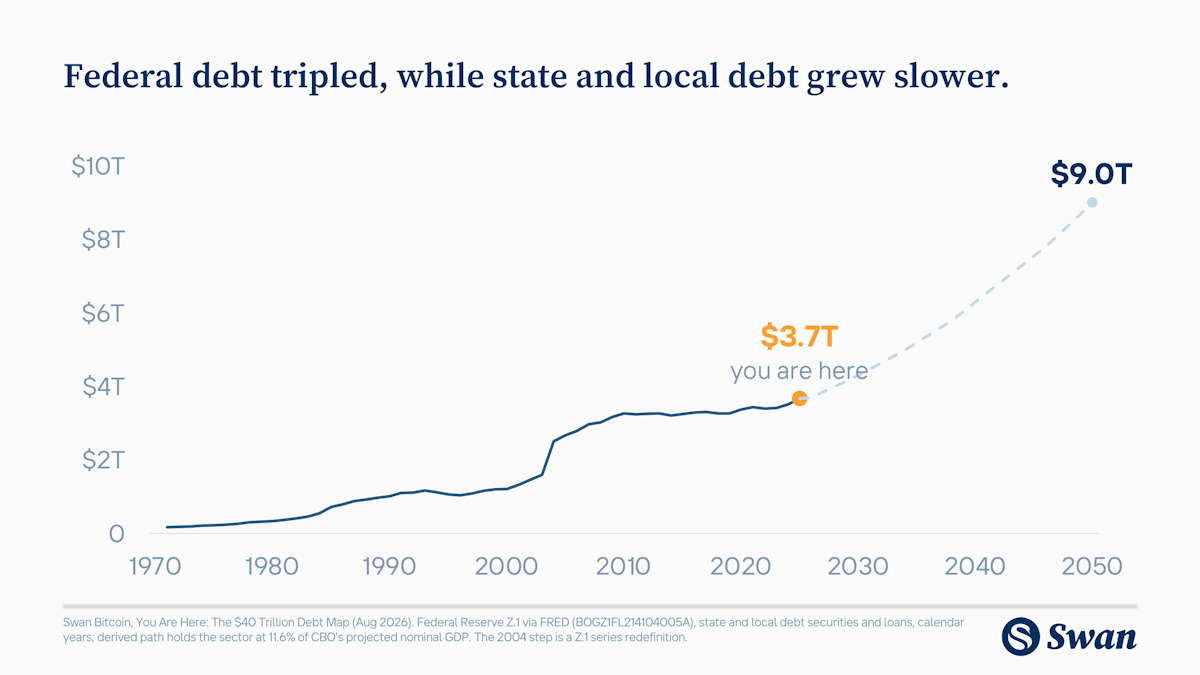
State and city bonded debt is $3.7 trillion, and it has been essentially flat since 2010. Every state but Vermont operates under a balanced-budget rule, so the state and local government debt fell from about 22% of GDP in 2010 to under 12% today, over the exact span in which federal debt tripled. States cannot print their own money or create their own currency, so fiscal stress surfaces instead as spending cuts (rare) and tax increases (common).
But the obligations from past promises are real even where the borrowing is capped. Public pensions are underfunded by $1.5 trillion as the plans report it, and closer to $4.6 trillion when the same promises are discounted honestly at market rates.
GAO, one institution that models the sector, projects the operating balance staying negative through the 2060s and says closing the gap would take a 20.7% cut in state and local spending, maintained every year, forever. How likely is that where you live?
No federal projection includes any of these obligations. No baseline assumes a bailout. But the structural pressure runs one direction, as we have seen throughout history in banking, insurance, and other industries. Congress created the Pension Benefit Guaranty Corporation (PBGC) in 1974 to insure private-sector pensions, obligations that were never federal, and wrote directly into the statute that the United States is not liable for what the corporation owes.
Then the American Rescue Plan of 2021 created Special Financial Assistance for failing multiemployer plans, and roughly $78 billion has now been approved for 161 plans covering 1.8 million participants.
Held at its current share of the economy, state and local bonded debt would reach about $9 trillion by 2050, with $1.5 to $4.6 trillion in unfunded pension promises. None of that sits on the federal balance sheet today. The PBGC is the precedent for how quickly that changes.
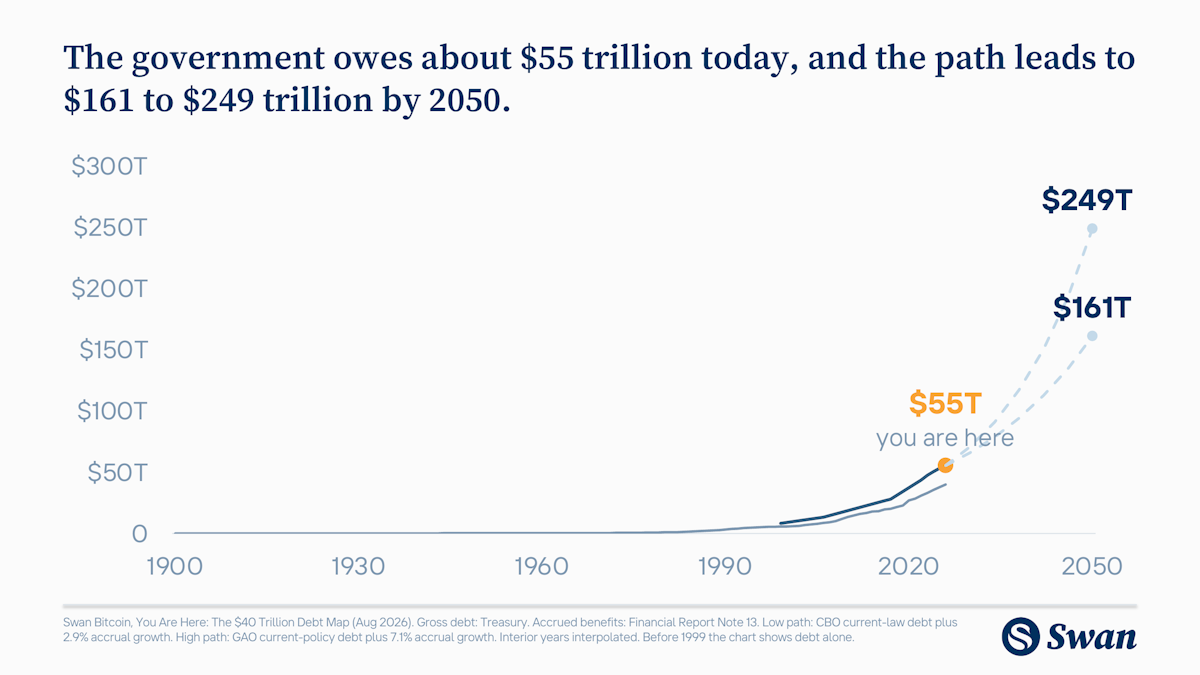
Today, the federal government owes $40 trillion in debt and another $15.5 trillion in benefits already earned. About $55 trillion, all in.
By 2050, the total is projected to reach $161 trillion at the lower bound: CBO’s current-law debt path plus the slowest year of benefit growth on record extended for a quarter century. At the upper end, it reaches $249 trillion: GAO’s current-policy path plus the benefits’ average growth rate since 1999. That is three to four and a half times today’s total in 24 years.
The top of that range has a tension in it. The two components move in opposite ways with interest rates. Higher rates push the debt projections up, because the Treasury pays more to borrow. And higher rates also push the accrued liability down, because those future benefit payments are discounted at Treasury yields. So $249 trillion requires a slightly contradictory world with rates high enough to hit GAO’s debt path and low enough to keep the present value of the promises elevated. Even the $161 trillion lower bound assumes best-case forever, so the real number is above that.
Either way, the shape does not change; it’s only a question of how fast it increases.
The projections above assume no future wars, no recession, no bailout, nothing but the laws and policies already on the books. Every surprise of the last fifty years has pushed the number higher.
Without a gold standard, debt lost its anchor, and the dollar lost its floor. The government owes more units, and each unit buys less. No vote. No choice. It is simply what happens when money can be created at will, and every incentive in a political economy says print more.
Every number in this article is denominated in dollars, and that is the whole point. When obligations compound faster than the economy servicing them, governments do not repay. They inflate, and they hold rates below inflation for as long as it takes. An interest bill of $4.8 trillion is not paid at market rates. It is paid by making the dollars worth less.
That arithmetic sets the price of everything else. Equities make new highs. Housing makes new highs. Both look considerably weaker when measured against assets whose supply cannot be expanded to meet the demand. The denominator is doing the work, and almost nobody is measuring it.
Which is why hard assets absorb the pressure, and why the hardest of them responds first and moves furthest. Gold cannot be printed. Neither can Bitcoin. Only one of them has a supply schedule fixed by consensus and knowable to the final unit.
Federal obligations are about $55 trillion today. The lower bound path reaches $161 trillion by 2050. There will only ever be 21 million bitcoin.
Accrued liability. An obligation recorded when it is incurred, before any cash moves. The opposite of cash accounting, which the federal budget uses. The budget, and therefore every debt projection, records these benefits only in the year each check is written.
Baseline. A projection of spending, revenue, and debt assuming no new legislation. A benchmark for measuring change, never a forecast of what Congress will do.
Current law vs current policy. Current law assumes statutes are executed exactly as written, including tax cuts expiring on schedule; the CBO projects this way. Current policy assumes today’s arrangements simply continue; GAO, Treasury, and Penn Wharton project this way, which is why their paths run higher.
Debt held by the public. Treasury securities held outside the federal government by individuals, pension funds, banks, the Federal Reserve, and foreign governments. The measure most projections publish. About $32.2 trillion today.
Deficit. The annual gap between what the government spends and what it collects, financed by issuing new debt.
Defined benefit vs defined contribution. A defined benefit plan promises a specified monthly payment in retirement, so the sponsor carries the investment risk and can fall short. A defined contribution plan, such as a 401(k) or the federal Thrift Savings Plan, promises only the contributions, so it cannot become underfunded. Every liability discussed in this piece is of the first kind.
Federal employee and veteran benefits payable. The balance sheet line for benefits soldiers and civil servants have already earned for service already rendered, including pensions, veterans’ disability compensation, retiree health. An accrued liability, recognized when earned rather than when paid. It becomes debt only as each payment comes due and is financed. $15.5 trillion as of FY2025.
Fiscal year (FY). The federal budget year, October through September. FY2026 ends September 30, 2026. State and local figures from the Federal Reserve run on calendar years.
Gross federal debt (called total federal debt in this piece). Every Treasury security outstanding, consisting of debt held by the public plus intragovernmental holdings. This is the measure subject to the statutory debt limit. $40.0 trillion as of August 2026.
Intragovernmental holdings. Treasury securities one arm of the government owes another, mostly trust funds of Social Security, the military and civil service retirement funds, the Thrift Savings Plan’s G Fund. About $7.8 trillion, the difference between gross debt and debt held by the public.
Net interest. Interest paid on debt held by the public, net of interest income the government receives. Excludes the interest the government credits to its own trust funds.
Nominal dollars. Dollars of the year in which they are spent, unadjusted for inflation. Used deliberately throughout the article. These are the actual dollars borrowed, and the actual dollars that must be created to service them.
Present value and discount rate. A stream of future payments expressed as one number today by discounting at an interest rate. Treasury discounts benefit obligations at Treasury yields, about 3.1%, under federal accounting standard SFFAS 33. Lower rates swell a present value and higher rates shrink it; the payments owed do not change.
Statutory debt limit. The legal ceiling on total federal debt issuance, set in dollars by Congress. It applies to gross debt, which is one reason gross is the right measure to track.
Unfunded pension liability, accounting basis vs market basis. Promised benefits minus plan assets. On the accounting basis, plans discount at their own assumed investment returns, near 7%. On the market basis, the same promises are discounted at market rates. Identical obligations, $1.5 trillion versus $4.6 trillion.
CBO, Congressional Budget Office. The nonpartisan agency that produces budget and economic projections for Congress. Projects on a current-law basis, which is why its path runs lowest of the four.
Debt to the Penny. Treasury’s daily publication of the exact outstanding public debt. Source of the $40.0 trillion August 2026 figure.
Derived. Any figure in this article that was calculated rather than published by an institution. For example, the conversion from debt held by the public to gross debt, the 2.9% and 7.1% benefit growth paths, the state and local path, and the combined 2050 range. Each is flagged where it appears.
ERISA, Employee Retirement Income Security Act of 1974. The law governing private-sector retirement plans, which created the PBGC.
Fed Z.1. The Federal Reserve’s quarterly Financial Accounts of the United States. Source of state and local debt outstanding.
GAO, Government Accountability Office. Congress’s audit and evaluation arm. Publishes long-term fiscal simulations for the federal government and, separately, for the state and local sector.
GDP, gross domestic product. The annual output of the economy, used here as the denominator when debt and interest are expressed as shares.
LTBO, Long-Term Budget Outlook. CBO’s 30-year projection, published as shares of GDP alongside its own nominal GDP path. Source of the figures past 2036 here.
MTS, Monthly Treasury Statement. Treasury’s monthly report of federal receipts and outlays. Source of the net interest actuals.
OASI and OASDI. Old-Age and Survivors Insurance, the Social Security retirement trust fund, and the combined program, including Disability Insurance. OASI reserves reach zero in FY2032 on CBO’s baseline.
OMB, Office of Management and Budget. The White House budget office. Its Historical Tables are the standard source for federal budget series back to 1940 and earlier.
PBGC, Pension Benefit Guaranty Corporation. The federal corporation was created in 1974 to insure private-sector defined benefit pensions. It covers about 30 million participants across 23,500 plans. It is funded by employer premiums, and by statute, the United States is not liable for its obligations, a limit Congress set aside in 2021 when it appropriated Special Financial Assistance to failing multiemployer plans.
PWBM, Penn Wharton Budget Model. The nonpartisan economic and budget modeling group at the University of Pennsylvania’s Wharton School, led by Kent Smetters. The only non-government source among the four projections here. Projects on a current-policy basis.
SFFAS 33. The federal accounting standard governing how agencies select discount rates and valuation dates for pension and benefit liabilities. This is why Treasury discounts these obligations at Treasury yields rather than at an assumed rate of return.
Treasury SLTFP, Statement of Long-Term Fiscal Projections. The long-range projection inside the Treasury’s audited annual Financial Report of the U.S. Government.
Federal debt levels. Treasury Fiscal Data, Historical Debt Outstanding, fiscal years 1900 to 2025; Debt to the Penny for the August 2026 figure. Charts 1, 2, 4, 7.
Net interest. OMB Historical Tables via FRED series FYOINT, FY1971 to 2014; Treasury Monthly Treasury Statement, table 9, FY2015 to 2025. Chart 3.
Federal projections to 2050. Congressional Budget Office, February 2026 baseline and Long-Term Budget Outlook, via the CBO open data repository; Penn Wharton Budget Model, January 2025; Government Accountability Office GAO-26-108610; Treasury, FY2025 Financial Report of the U.S. Government, Statement of Long-Term Fiscal Projections. Charts 3, 4, 7.
Accrued federal employee and veteran benefits. Treasury, FY2025 Financial Report, Note 13, with the FY2024, FY2023, and FY2017 vintages for the historical series; executive summary for total liabilities. Growth paths beyond 2025 are derived. Charts 5, 7.
State and local. Federal Reserve Financial Accounts (Z.1) via FRED series BOGZ1FL214104005A; Reason Foundation Annual Pension Report 2025; Hoover Institution (Giesecke), market-basis valuation, FY2023; Equable Institute, State of Pensions 2025; GAO state and local fiscal model and GAO-20-269SP. Chart 6.
Pension Benefit Guaranty Corporation. PBGC FY2025 Annual Report; Congressional Research Service, PBGC: A Primer (95-118), for Special Financial Assistance totals and the ERISA liability language.
Purchasing power. Bureau of Labor Statistics Consumer Price Index, 1971 to 2026.
The penny. U.S. Mint, final circulating one-cent strike, November 12, 2025.
Derived figures. The following are calculated, not published by any institution: the conversion of debt held by the public to gross debt using a flat $7.5 trillion intragovernmental wedge; the 2.9% and 7.1% growth paths for accrued benefits; the state and local path held at 11.6% of GDP; and the combined $161 trillion to $249 trillion range. Method and assumptions for each are recorded in the data payload of the companion chart files.
In this article
Thoughts on Bitcoin from the Swan team and friends.
How Swan built an agentic software factory that finds production bugs, reaches consensus on the fix, opens the PR, and proves it works before a human merges.
From entropy and SHA-256 to proof of work and the 21 million cap: a first principles guide to how Bitcoin works, and what you can verify yourself.
A history of every Bitcoin hard fork, from Bitcoin Cash and Bitcoin Gold to the 2026 BIP-110 split, and why each new coin collapsed against Bitcoin.