


Swan Private Market Update
This market update was originally sent to Swan Private clients. Swan Private guides corporations and high net worth individuals globally toward building generational wealth with Bitcoin.
This market update was originally sent to Swan Private clients. Swan Private guides corporations and high net worth individuals globally toward building generational wealth with Bitcoin.
These days, we seem to get news that in any other year would be the story of the year, but in 2022, it’s just another day. In the last week alone, we had the longest-running PM of Japan, Shinzo Abe, killed by an assassin, UK PM Boris Johnson abruptly resigned, Italian PM Mario Draghi offered his resignation, Sri Lanka divulged into country-wide protests amidst economic collapse, and Europe continues to deal with an energy crisis as a result of the Russian-Ukraine conflict.
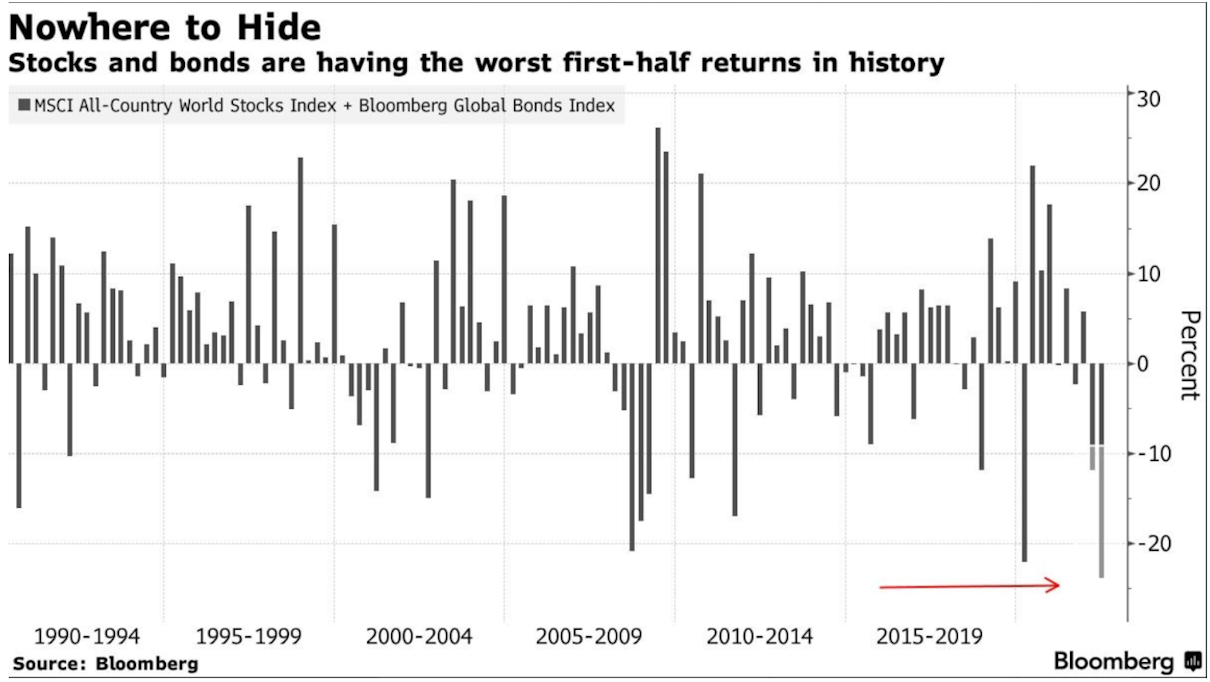
On top of all that, the world continues to struggle with consumer price inflation that is sweeping the globe as the price of food and energy continue to be impacted by geopolitical events. Investors currently fear a coming recession as the Federal Reserve continues on its mission to tame CPI inflation. This is all occurring as we close out the worst first-half returns for stocks and bonds in history. In 2022, there have been few places for investors to hide.
CPI inflation exceeded forecasts once again when it was reported Wednesday at 9.1% YoY, the highest reading since the end of 1981. When taking a closer look at the data, it gets even more troubling. Grocery prices have increased 12.2% YoY, and gasoline prices have increased nearly 60% YoY. The cost of essentials is getting much more expensive for everyday Americans.
The high CPI print caused the market to immediately shift its focus to the Federal Reserve. Given that the unemployment rate still remains historically low, and recent July data showed job openings currently at record-highs, this red-hot CPI number gives the Fed even more of a green light to be aggressive with its policy to stabilize prices.
Buy automatically every day, week, or month, starting with as little as $10.
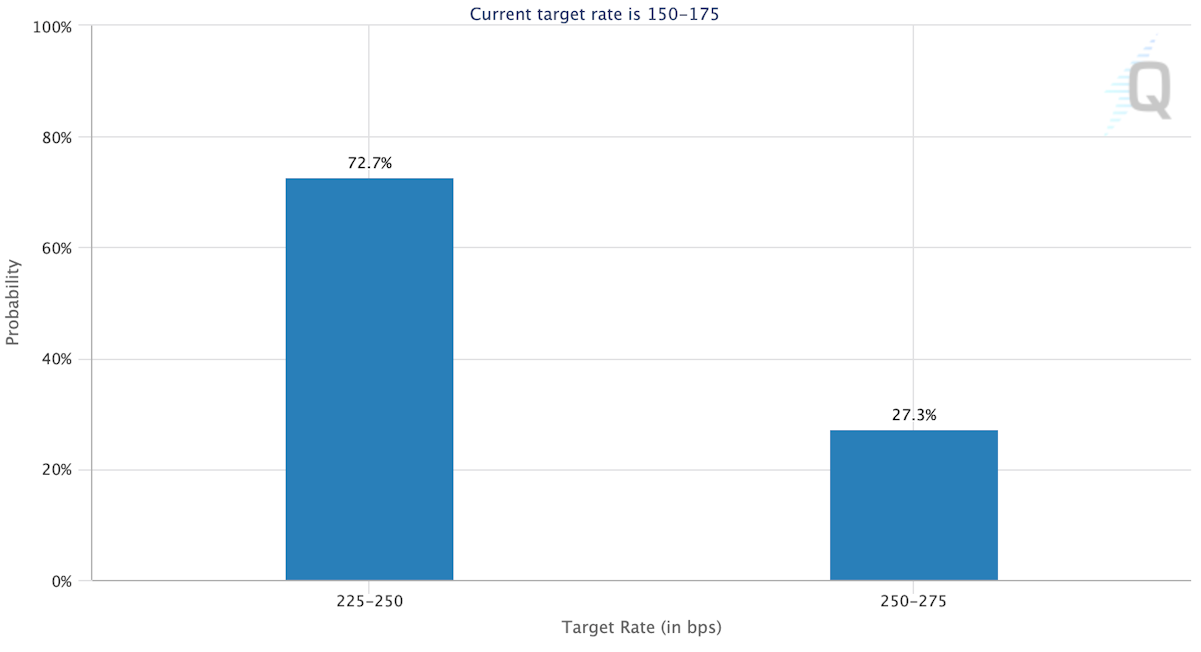
The market now shows a 27% probability of the Fed hiking interest rates a full 1% at its next July meeting. Two weeks ago, this was given a 0% probability by the market. If it turns out to be the case, it would mark the first time the Fed has raised a full percentage point in one meeting since 1981.
Furthermore, federal fund futures markets are now implying a peak federal funds rate of 3.68% in December 2022 followed by a pause in rate hikes in January 2023, and then a return to rate cuts in late 2023 — early 2024. Said differently, the market is expecting the Fed to raise rates til the end of the year, pause when markets start to react, and then turn around and start cutting rates again around 2024.
It’s always important to point out that CPI is a lagging indicator. The bond market, on the other hand, is forward-looking, and it’s already flashing signals that it sees a recession in the near future.
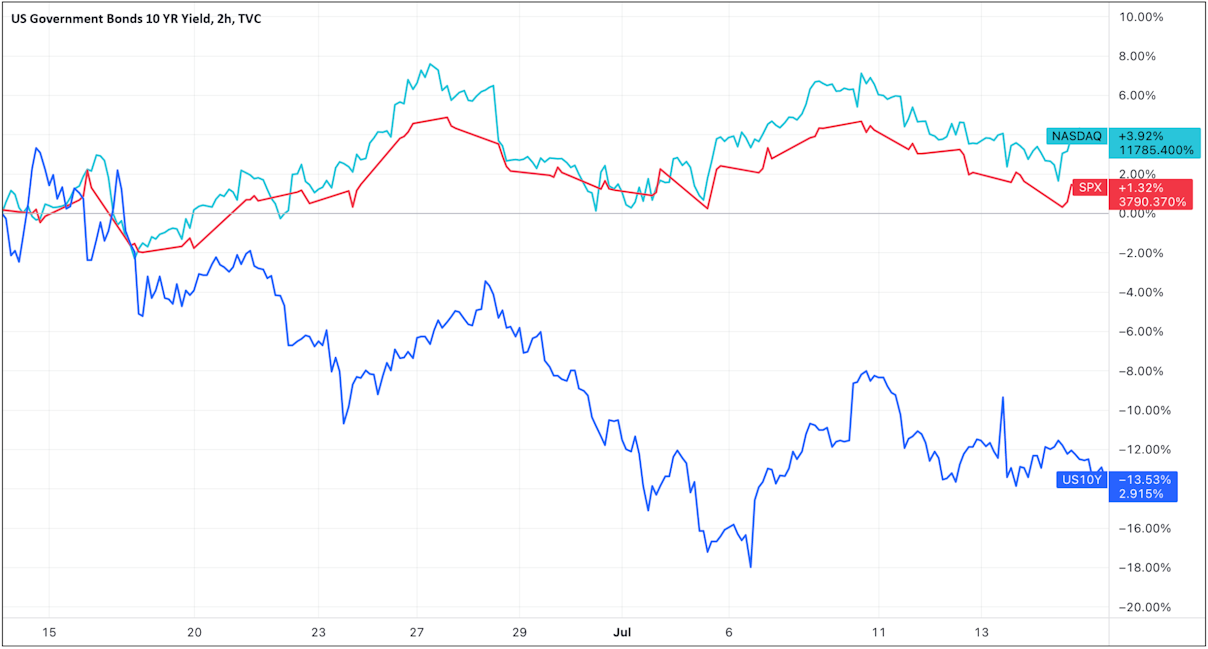
The 10Y Treasury yield has risen rapidly most of the year but has been in a steady decline since it peaked at around 3.5% in mid-June. It is down 55 bps since that time. As a result, since the 10Y yield peaked, we have seen stock prices finally begin to stabilize. The S&P 500 is up 1.32% and the Nasdaq is up 3.92% since the 10Y yield topped out in June.
If the 10Y remains under its 3.5% peak, this could be interpreted as the market thinking the Fed tightening cycle is close to over and is sniffing a coming recession and already looking ahead to potential Fed rate cuts. Founder of NorthmanTrader, Sven Henrich was recently interviewed by Preston Pysh on an episode of the Investor’s Podcast, and in the conversation, he brilliantly explains why the 10Y yield is of particular importance,
This debt-laden system cannot handle higher rates. 3.2%, by the way, is what stopped it in 2018. In the fall of 2018, the 10Y hit 3.2%, markets fell apart, the Fed flip-flopped, and that was the end of it. That was with $8-9 trillion of less debt! So we cannot be in a situation where the 10Y continues to hover around 3.2% for an extended period of time.
If the 10Y breaks above this key 3.5% level, then asset prices could continue to suffer as the Fed’s tightening cycle continues.
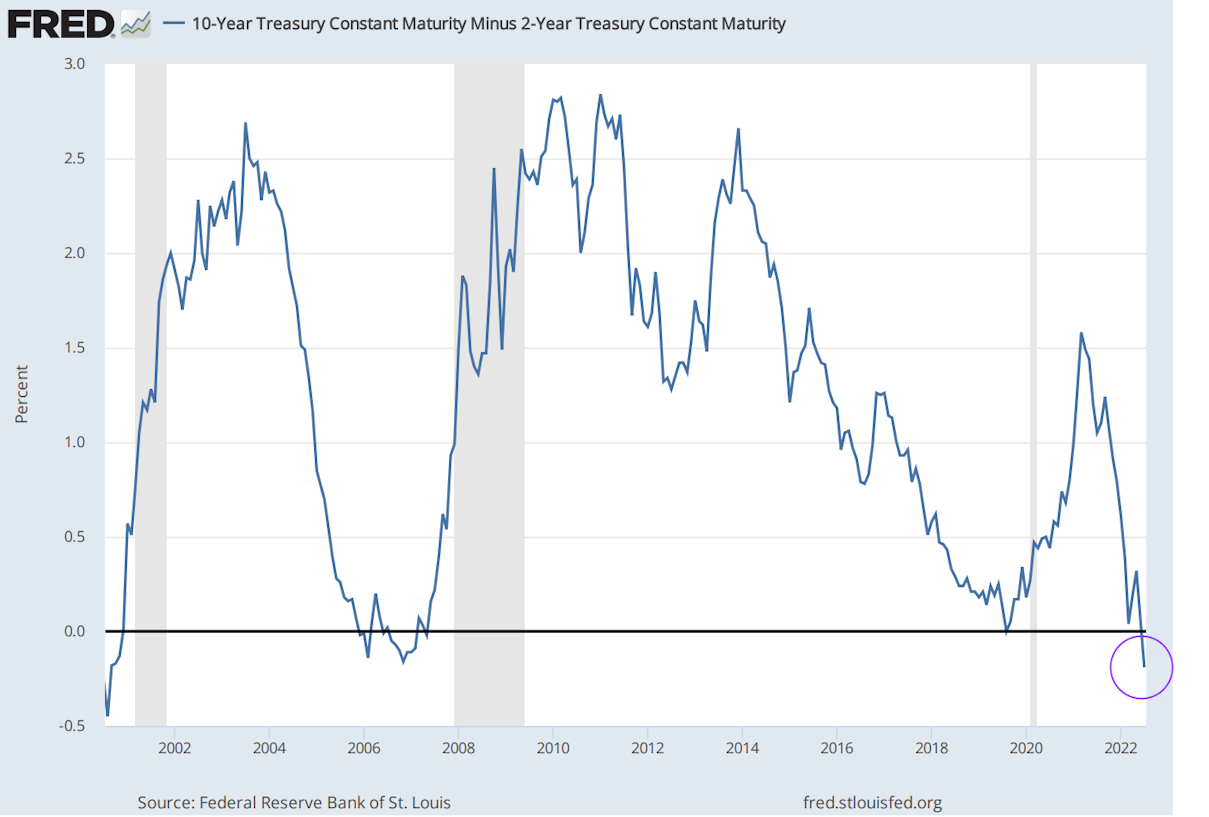
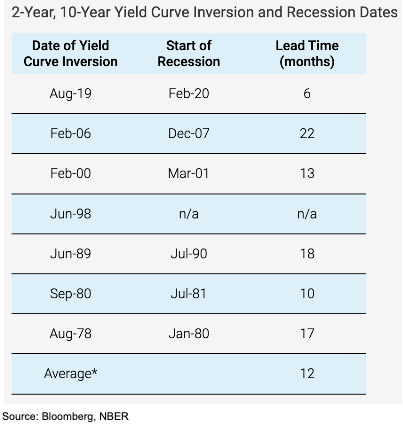
Another recessionary signal coming from the bond market came in the form of the 2s10s yield curve inversion. The 2-year Treasury yield first topped the 10-year yield back in the Spring, and now it has inverted to the steepest level since 2000, with the spread currently at -0.22%.
This has historically been a sign that investors foresee an economic downturn in the future. Banks make money off the spread between short and long-term interest rates. If banks can’t make money borrowing and then lending over longer time periods, then lending activity drops, and economic activity falls along with it.
This recession indicator has been a reliable one in the past. It has preceded nearly all recessions since the 1970s. However, it doesn’t necessarily mean a recession is coming next week. The average lead time of the 2s10s inversion to the start of a recession is 12 months.
This 2s10s inversion only serves as another sign that the bond market is not really buying this whole belief that the fed funds rate will peak around 3.7% by December. Instead, the bond market appears to be sniffing out a recession and potential Fed pivot, but when that happens exactly is anyone’s guess.
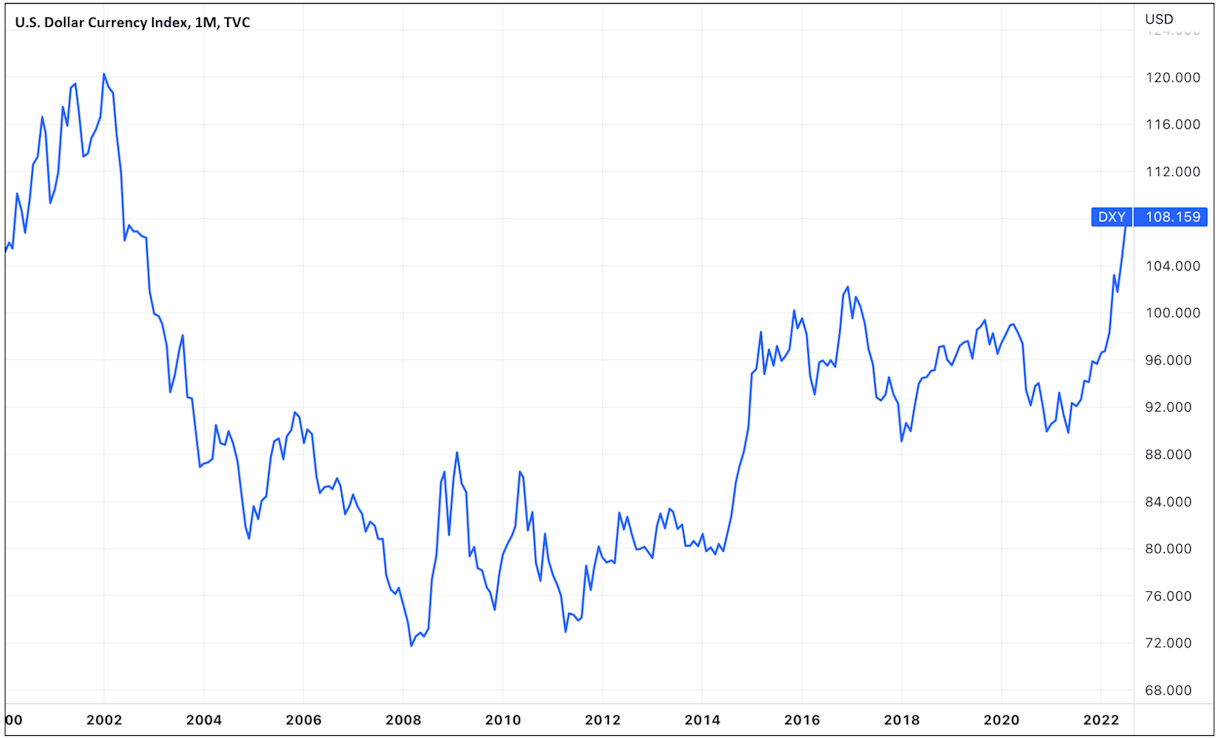
The dollar is another chart of particular importance to keep an eye on today. Given the amount of US-dollar denominated debt in the system, a strong dollar would make it more expensive to service that debt, increasing the risk of defaults across the globe.
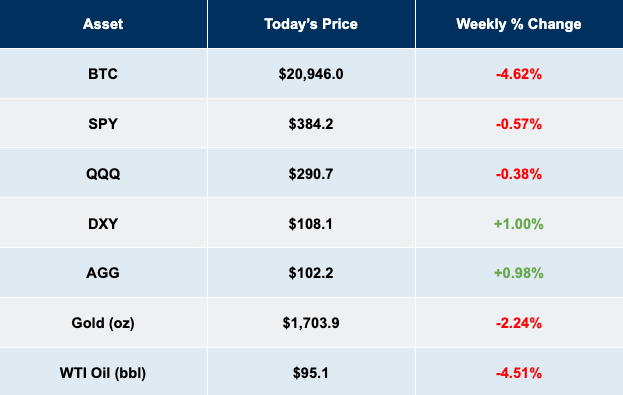
The dollar has been strong and getting stronger year-to-date. The DXY is a measure of dollar strength against a basket of 6 foreign currencies. The DXY is currently sitting at its highest level since 2002, up 12.5% YTD.
A strong dollar that is continuing to strengthen like this has many interpretations. First off, it is a sign that investors are going risk-off as they fear a recession looming and are fleeing to the safety of the dollar. Secondly, it can be viewed more as weakness in the currencies that the DXY compares the dollar against, mainly the euro and the yen. The euro and yen constitute over 70% of the DXY index, and both of these currencies have come under severe pressure of late.
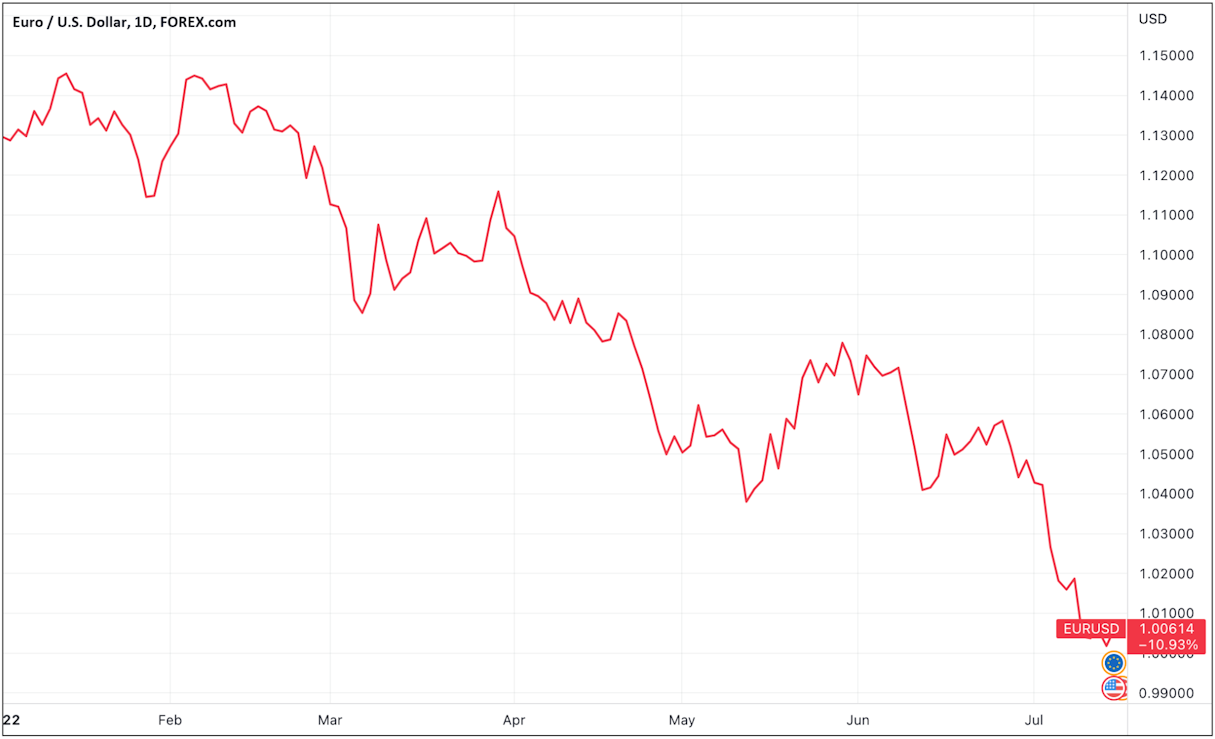
The euro has been sliding as investors worry that continued high consumer price inflation, primarily due to high energy prices, will push Europe into a recession. Eurozone consumer price inflation hit a record-high of 8.6% YoY in June. As a result, the euro has been depreciating against the dollar at a rapid rate. The euro has depreciated by -10.93% YTD against the dollar and briefly dropped below dollar parity for the first time since 2002. Today, it sits squarely at dollar parity.
A contributing factor to the yen’s downfall has been the monetary policy of the European Central Bank, which has been slow to raise rates to combat rising prices as the Federal Reserve hikes at the most aggressive pace in decades. The ECB has already held an emergency meeting in response to rising yields across Southern European countries like Italy and Greece. From the meeting, they introduced a new “anti-fragmentation” tool that sounds awfully similar to Quantitative Easing. In other words, the ECB is still performing accommodative policy in the face of a rapidly depreciating euro and record-high CPI inflation prints.
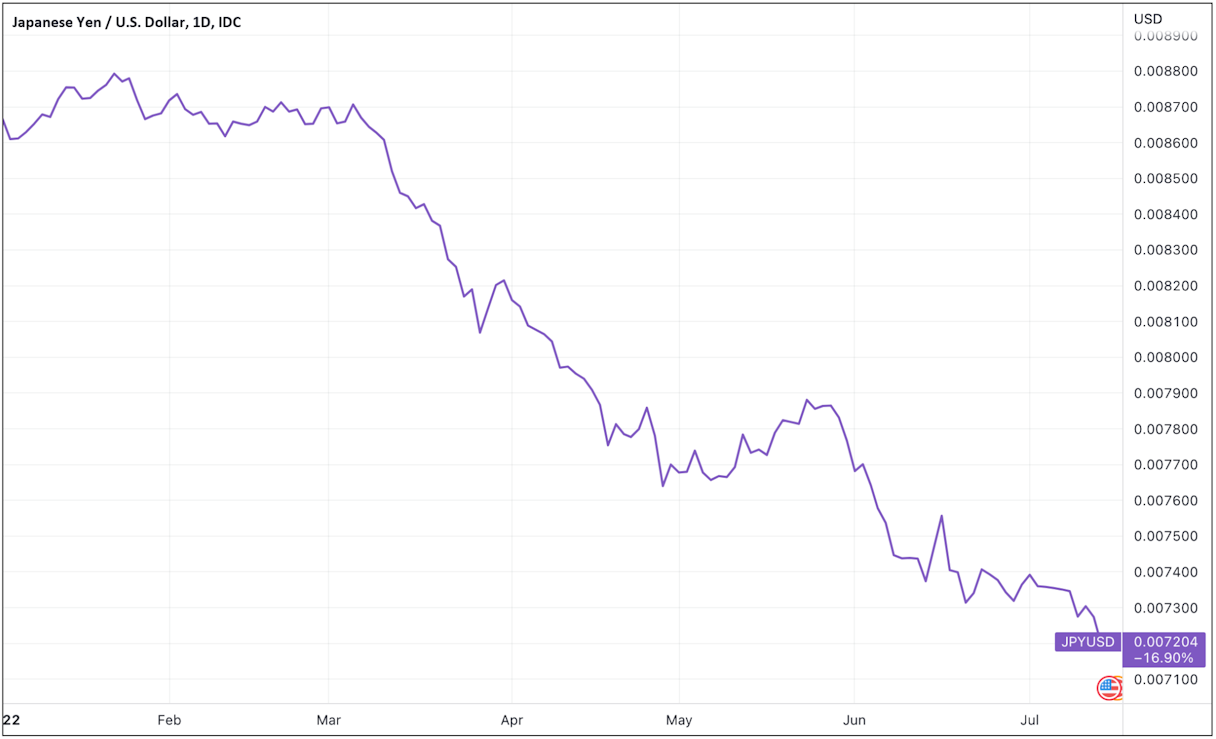
The other major currency that has experienced significant pressure over the last month is the Japanese yen. The yen is down an astonishing -16.9% YTD, a 24-year low.
The yen started coming under pressure when the Bank of Japan needed to print billions of yen to purchase their own bonds to maintain the peg of their 10Y yield at 0.25%. The result has been the rapid devaluation of the yen relative to the dollar. Given the amount of debt in Japan’s economy, they are particularly sensitive to increasing interest rates, so one can understand their desperation to maintain their interest rates at low levels. However, with a hawkish Fed and a rapidly depreciating yen, they now find themselves in a dilemma. Do they continue to peg rates at the expense of their own currency, or do they abandon the peg to stop the yen from bleeding out?
The good news is Japan might get some help from their friends in America. US Treasury Secretary Janet Yellen met with her Japanese counterpart to discuss the recent currency exchange rate volatility. From the meeting, Yellen stated that the US would be willing “to cooperate as appropriate on currency issues, in line with our G-7 and G20 commitments.” This statement could be foreshadowing a scenario where the US has to intervene in currency markets and devalue the dollar to take pressure off their allies in Europe and Japan in the name of global financial stability.
In the face of rising consumer price inflation seemingly everywhere, there have been some signs of demand destruction in the economy, which is exactly what the Fed wants to see.
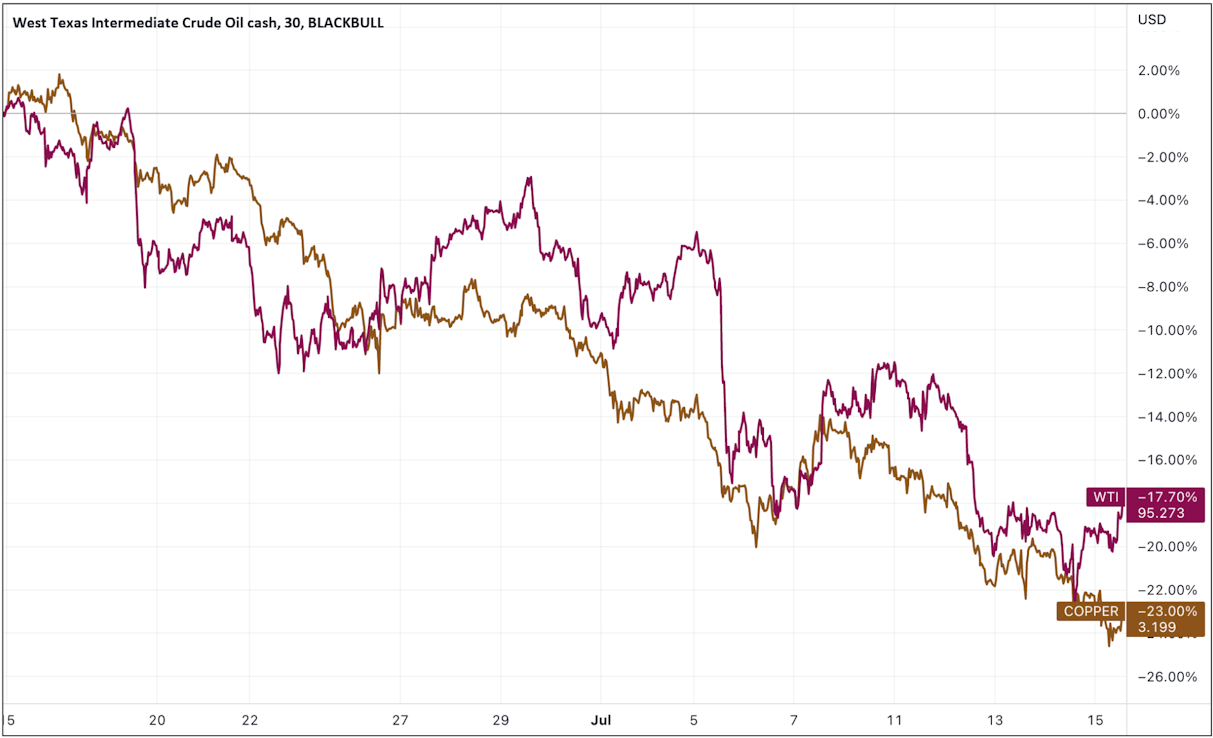
Copper has historically been viewed as a key leading economic indicator due to the demand for the base metal being closely tied to multiple sectors across the economy. When looking at the copper chart, demand for copper has fallen off a cliff this month. It is currently down -23% in the last 30 days.
Oil can be thought of similarly, given that it is an input for nearly all economic activity across all sectors, and it too is finally starting to roll over. WTI oil fell below $100/barrel in early July and is now at $95/barrel, down -17.7% in the last month.
The fall of oil and copper prices can be seen as indicators of slowing demand throughout the economy, which is yet another sign that an economic downturn is coming.
Whether it’s the bond market, foreign exchange markets, or commodity markets, they are all telling the same story: a deflationary impulse is on the horizon. Although the 9.1% CPI inflation print shocked many market participants, it is vital to remember it is a backward-looking metric. All these other areas of the economy help paint a different picture of economic weakness and demand destruction as the Federal Reserve continues on its mission to rein in consumer price inflation.
Given a recession will likely cause the Fed to revert back to the more accommodative policy that markets have grown so fond of over the last decade, this can strangely be viewed as a tailwind for risk-on assets. This is the upside-down market in which we currently find ourselves. A recession is good nowadays because it will help reduce some of this consumer price inflation that disproportionately hurts the poorest in our society the most, and it increases the probability of a Fed pivot, which is a boon for asset prices.
Nobody knows for sure what will occur in these unprecedented markets. At the moment, the Fed must be pleased with the falling asset prices and the signs that demand in the economy appears to be slowing despite what the lagging CPI data says. We will continue to keep a close eye on Europe and Japan as their economies and currencies continue to be significantly impacted by the current macroeconomic backdrop. These jurisdictions will likely give us clues as to what central banks and governments might do next to try to return some stability to the global financial system.
Bitcoin continues to trade in line with the rest of the assets considered risk-on. It has continued to trade sideways in a range of $19,000-21,000 over the course of the last month. At the time of writing, the price of Bitcoin currently sits at $20,938, up 2.8% over the last two weeks.
Bitcoin is trading in a range around its 2017 bull market high of $20,000 as more developments come to light around the contagion that’s spreading throughout the broader crypto market. Over the past couple of months, we have experienced a major deleveraging event as many investors and cryptocurrency platforms turned into forced sellers during the market turmoil.
This daisy chain of risk really began with the Luna/UST crash, which caused the Three Arrows Capital Ponzi scheme to be exposed, which led to the significant stress on many centralized cryptocurrency lending platforms such as Celsius, Voyager Digital, and BlockFi.
Since our last market update, BlockFi narrowly escaped insolvency when it struck a deal with FTX to acquire them for up to $240 million, and both Voyager Digital and Celsius have filed for Chapter 11 bankruptcy protection. The drama around the embattled hedge fund, Three Arrows Capital, also continues. They too filed for bankruptcy last week, but there are rumors that its founders are not cooperating with lawyers in the liquidation process. News continues to trickle out about new firms that had exposure to Three Arrows Capital, with Blockchain.com being the latest to emerge after they announced a $270 million loss. We believe reports of contagion from this mess will continue to come out in the coming weeks.
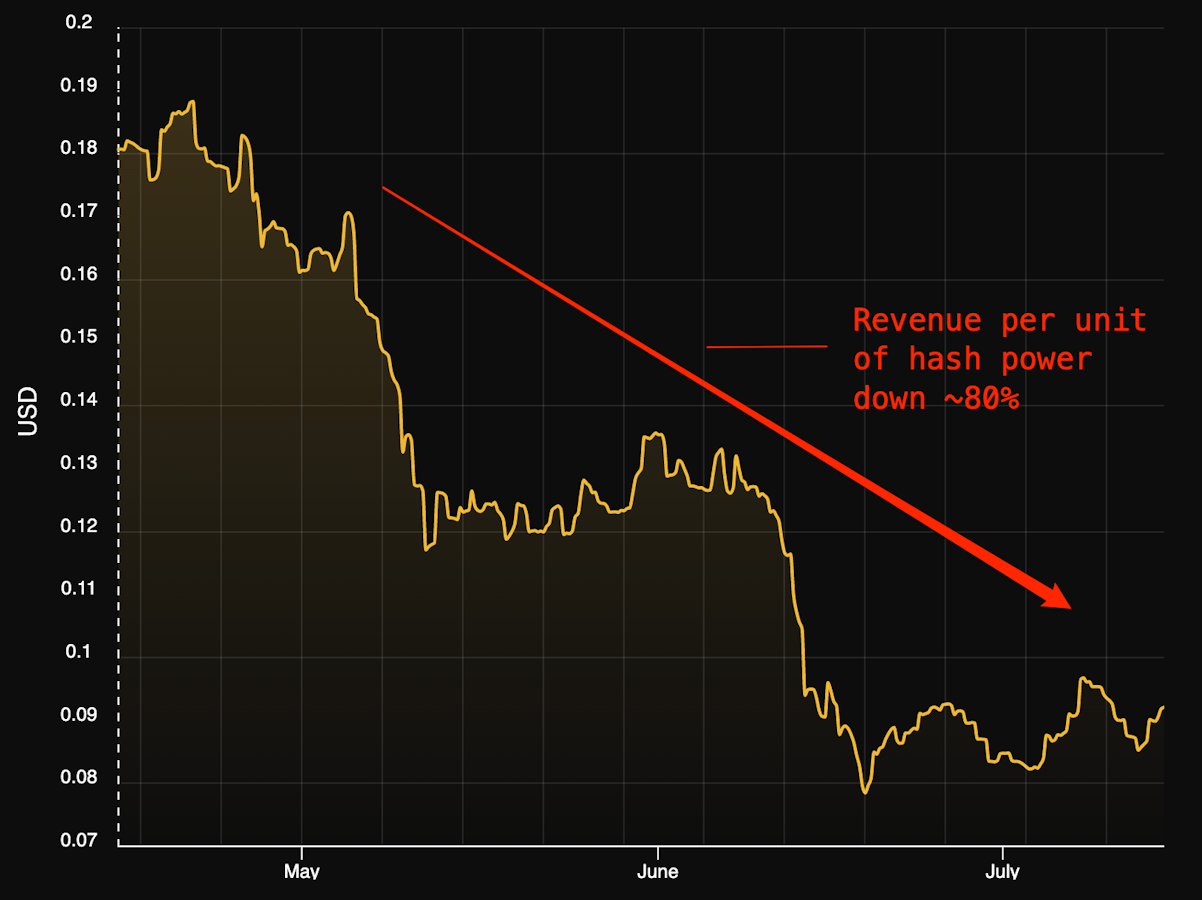
Another area of the market that has experienced some forced selling is Bitcoin miners. Bitcoin miners have been in a precarious situation since general market conditions turned in 2022. Due to a combination of tightening credit conditions, higher energy prices, the downward price action, and the level of Bitcoin’s hash rate, miners’ profit margins are being compressed across the board.
One can see this quantified when looking at the decline in Hashprice over the last year. Hashprice refers to the expected value of 1TH/s of hashing per day, and it can be used to estimate how much dollar-denominated revenue a miner can expect to earn per unit of hashing power per day. Hashprice is currently sitting at $0.085 USD/TH/day, down ~80% since it peaked in October 2021, and under $0.10 for the first time since October 2020.
Luxor
Operations are less profitable for these miners. To make matters worse, during the raging bull market, many public miners took on debt and held onto the Bitcoin that they mined. Based on the financial statements from some of the largest public or private Bitcoin mining companies, it’s estimated that ~$5.8 billion was raised by these entities during 2021 alone.
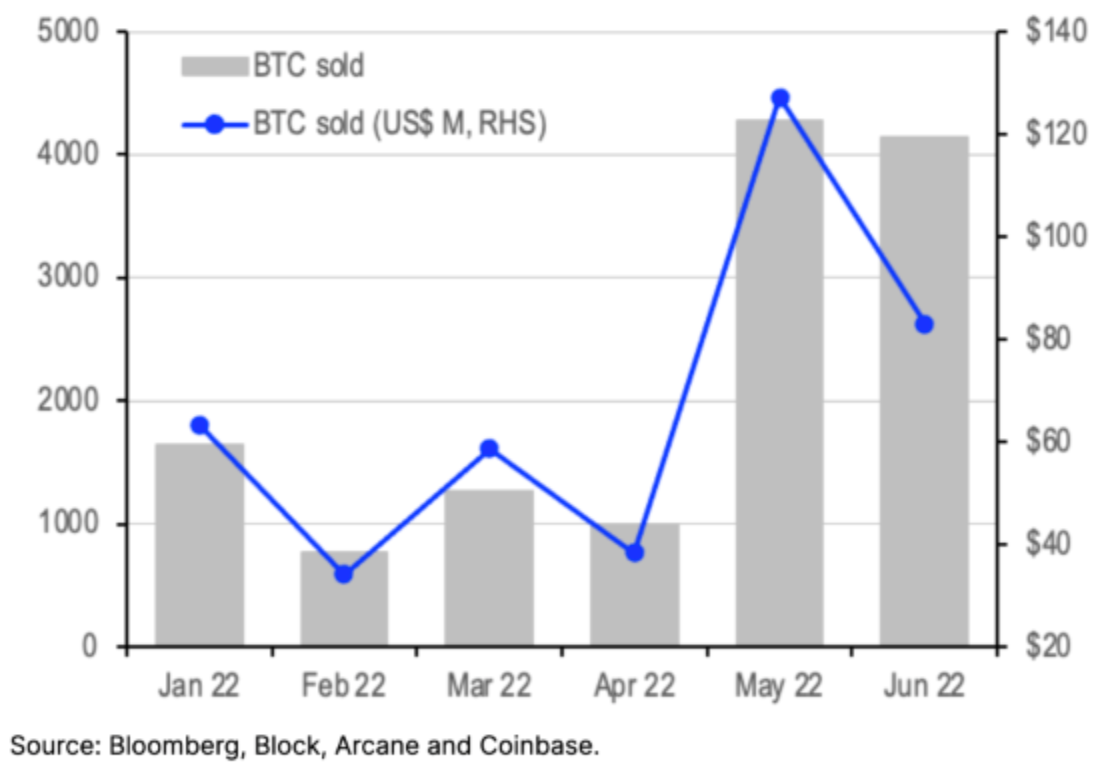
Now these miners are becoming forced sellers of their Bitcoin reserves to service their debt obligations and pay their operational costs. A perfect example occurred when Core Scientific announced they sold 7,202 BTC in the last month at an average price of $23,000 to raise $167 million for “payments toward ASIC servers, capital investments in additional data-center capacity, and debt repayments.” Core Scientific isn’t alone, ~13,000 BTC have been sold by the top 28 public miners in 2022.
The real question then becomes…when will these public miners stop selling their Bitcoin?
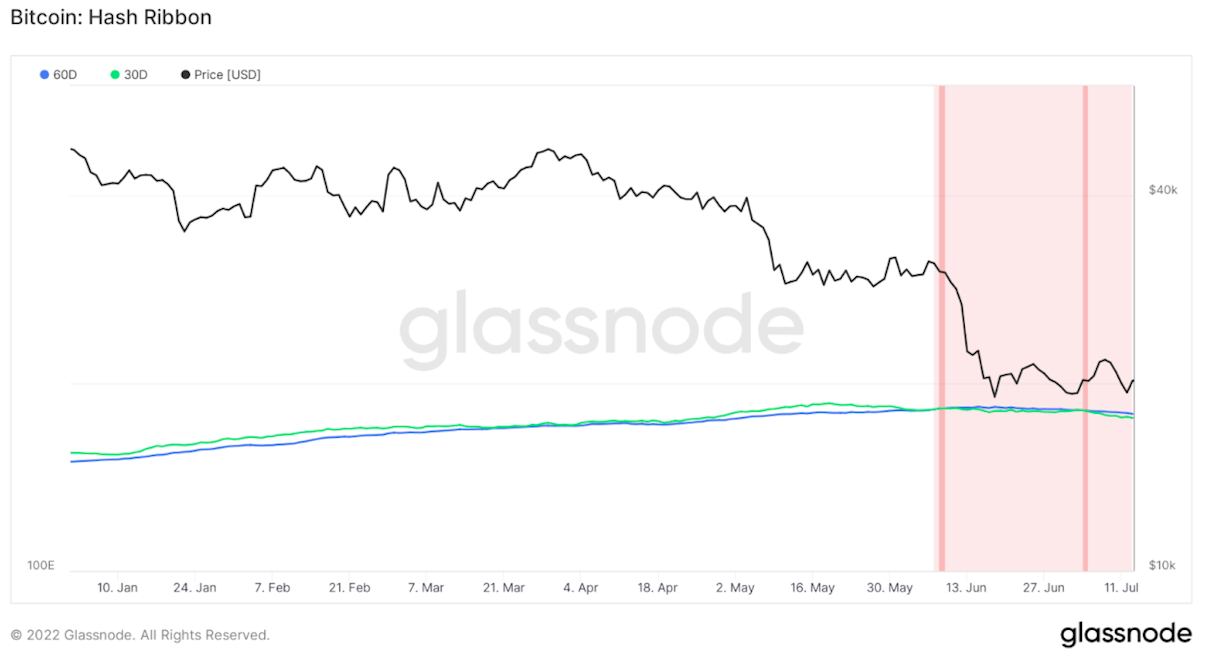
Well, no one can know for sure, but one metric that has served as a useful indicator of miner capitulation in previous bear markets is the Hash Ribbon Indicator created by Charles Edwards. This metric takes the 30-day and 60-day moving averages of the Bitcoin hash rate, and when the 30-day crosses above the 60-day moving average, historically, this has accurately marked times of the end of miner capitulation. One can think of this metric as a signal that a turning point has taken place where miners are starting to plug back in after a period of time when many miners have been unplugging their machines amid the bear market. This turning point is highlighted in the chart as periods where the light red shaded areas turn to dark red.
On July 4th, we saw the Hash Ribbon Indicator flash for the second time in the past month, but then the 30-day moved back below the 60-day, indicating that miners are still in capitulation mode.
This indicator is still showing that miners are in the middle of capitulation. The difficulty adjustment confirms this as we just had the largest downward difficulty adjustment since July 2021 of -5.01%, signaling that miners are unplugging their machines. This is the third consecutive downward adjustment. We will continue to track the Hash Ribbon Indicator and difficulty adjustment to get a sense of when this mining behavior begins to reverse trend.
As miners continue to get squeezed and are forced to sell their Bitcoin holdings, there was some positive news in miner land that gained some recognition. Texas’s ERCOT grid is currently under enormous stress as a heat wave has rolled through. In response, all industrial-size Bitcoin miners shut off their machines, and this allowed for over 1,000 MW of power to be pushed back onto the grid for retail and commercial use. This event highlights how Bitcoin miners can provide a unique flexible load demand that can improve the resiliency of electrical grids by shutting down with a flip of a switch in periods of peak demand like we are seeing in Texas today.
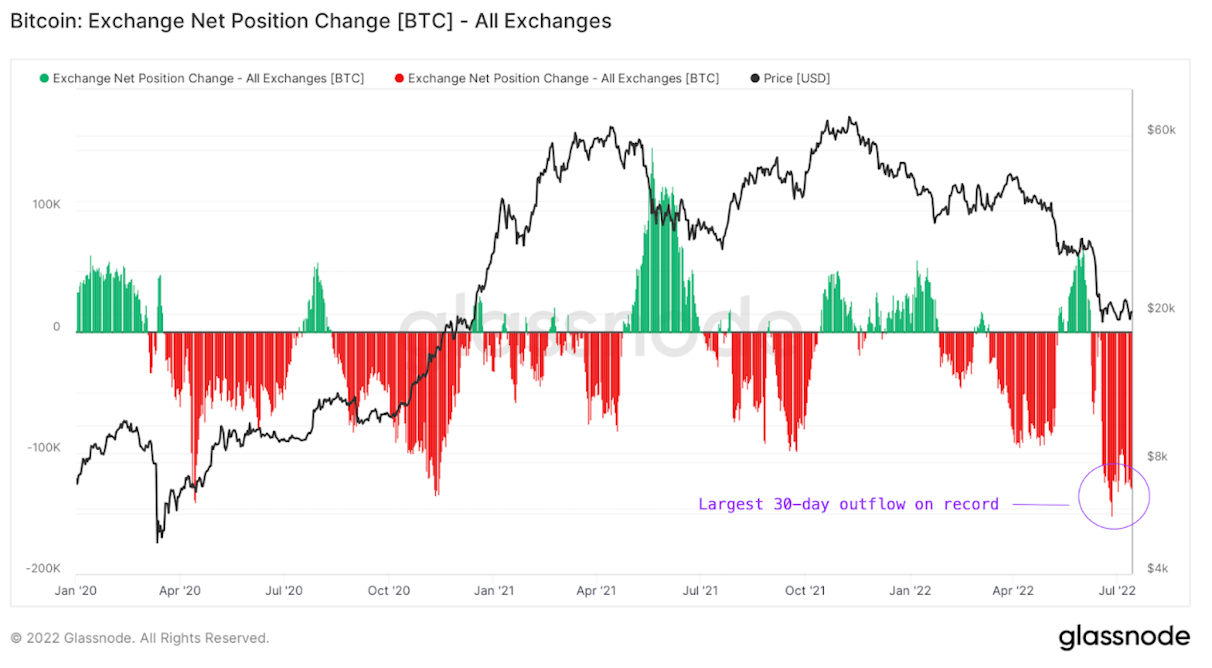
Outside of mining, there have been a couple of bright spots under the hood in the Bitcoin industry amidst the broader market turmoil. The first is that we just saw the largest monthly outflow of Bitcoin off exchanges on record.
Since the crypto contagion began and multiple crypto platforms have declared bankruptcy or experienced significant stress, we have seen a new urgency from investors to learn how to self-custody their Bitcoin. This is not only a good thing for investors to own their own private keys, but it is also a good thing for the Bitcoin network as it becomes less centralized when not as much Bitcoin is held on these centralized exchanges. One caveat is that we don’t know what percentage of these Bitcoins are being sent to third-party custodians, but the general trend is encouraging to see.
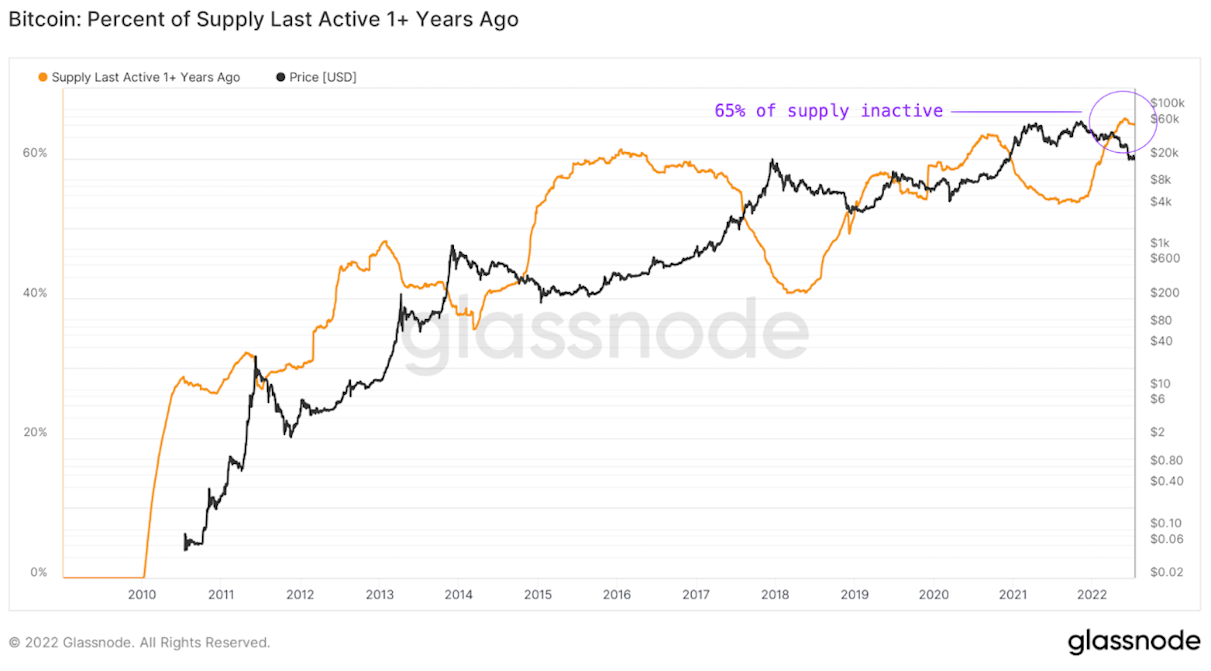
The second positive development is that we are not seeing any selling from long-term holders showing that this large price drawdown has not changed their conviction in Bitcoin as a long-term investment. Since July 2021, when the price of Bitcoin neared $35,000, we have not seen 65% of Bitcoin’s supply move.
Given that Bitcoin is down ~70% from its ATH, and we are seeing that 65% of the supply has remained inactive 1+ year ago, this is a sign that long-term Bitcoin holders are unphased by this drawdown. More Bitcoin is being retained by long-term holders with strong conviction in Bitcoin’s long-term value proposition. This is good to see because it is a sign that the speculators are leaving, and what remains is a much more stable, convicted investor base.
Overall, the forced selling from both miners and the crypto contagion continues to impact the price of Bitcoin. These dynamics, along with broader macroeconomic conditions, will likely continue to affect short-term price movements. However, long-term holders have not been phased by this, and miners may be close to capitulation. Regardless of the price action, Bitcoin continues to act as a money that cannot be debased, censored, or seized in a world where fiat currencies are falling victim to all three. It’s times like this when long-term investors can sleep well at night knowing their Bitcoin holdings are protected against dilution and confiscation.
Buy automatically every day, week, or month, starting with as little as $10.
Sam Callahan is the Lead Analyst at Swan Bitcoin. He graduated from Indiana University with degrees in Biology and Physics before turning his attention towards the markets. He writes the popular “Running the Numbers” section in the monthly Swan Private Insight Report. Sam’s analysis is frequently shared across social media, and he’s been a guest on popular podcasts such as The Investor’s Podcast and the Stephan Livera Podcast.
News
More NewsThoughts on Bitcoin from the Swan team and friends.
Live video verification, Jade Plus signing devices, and a purpose-built recovery assistant give families and businesses greater control over their Bitcoin.
Passkeys enable faster, more secure device-based logins (face/fingerprint) that reduce password risks and strengthen our Swan Guard security protections.
Swan Generations provides a unique service for parents, legal guardians, and others to make irrevocable gifts of real Bitcoin.
Audio narration