@GeertJanCap invites all analysts to reproduce the graphs to “peer-review” the analysis.
Abstract
Price changes are always a function of supply and demand changes, and Bitcoin’s supply changes are fully predictable.
Nevertheless, we have seen trough-to-peak cycles in price across Bitcoin’s supply halvings that suggest they do affect the price.
The halving supply shocks, which diminish in proportion from one halving to the next, have been roughly matched by a corresponding year-over-year price shock.
Similarly, the size of the pre-halving trough price to the post-halving peak price has diminished in scale with each subsequent halving.
The trend suggests that future halvings will lead to smaller price increases in subsequent periods. Ultimately, this will lead to little impact from halvings and instead result in demand growth and overwhelming supply shocks as the primary driver of Bitcoin’s price going forward.
Introduction
The price of any asset is determined by supply and demand. Bitcoin is the only asset in the world for which future production is and always has been, perfectly predictable and known to all.
Moreover, Bitcoin’s supply issuance follows a predetermined schedule. That schedule prescribes instantaneous reductions of its issuance by half the previous issuance roughly every four years (specifically every 210,000 blocks). These halvings continue until new issuance drops to zero, at which point no new coins are issued, and the total supply of 21 million coins is reached.
Much has been postulated about the impact of these halvings on the price of Bitcoin. This analysis aims to evaluate how significant halvings have been, and are expected to be, on the price of Bitcoin.
We compare the relative size of the halvings (as a proportion of the 21 million coin supply) on year-over-year supply changes with the year-over-year price changes in Bitcoin and note a correspondence.
We also compare the magnitude of price increases from the troughs before the halvings to the peaks after them and observe a correlation between the decreasing percentage of Bitcoins issued as a percentage of existing supply from one halving to the next.
This article does not present a model predicting the future price of Bitcoin, which remains unpredictable precisely because the demand for Bitcoin remains unpredictable.
Disclaimer:The Bitcoin price predictions below do not necessarily reflect the views of Swan Bitcoin. Swan does not make public Bitcoin price predictions. The purpose of this article is an attempt to show how several prominent figures reached their forecast, and is presented for the reader’s consideration.
Instead, its main aim is to isolate and investigate the impact that past and future halvings have had and may be expected to have on Bitcoin’s upward price reaction.
Year-Over-Year Impact of Halving’s on Bitcoin Issuance
Every halving leads to smaller increases in the circulating supply of Bitcoin.
According to the basic economic rules of supply and demand, a halving event represents a supply shock.
In all other economic assets, products, services, or commodities, prices increase when a supply shock occurs. This is true for both predictable and unpredictable supply shocks (e.g., fresh produce prices go up in winter even though we know supply will decline well in advance).
This fact about supply shocks permits us to explore the correlation of supply shocks on Bitcoin’s price, although there have only been three halvings and two complete halving periods.
So what do we see?
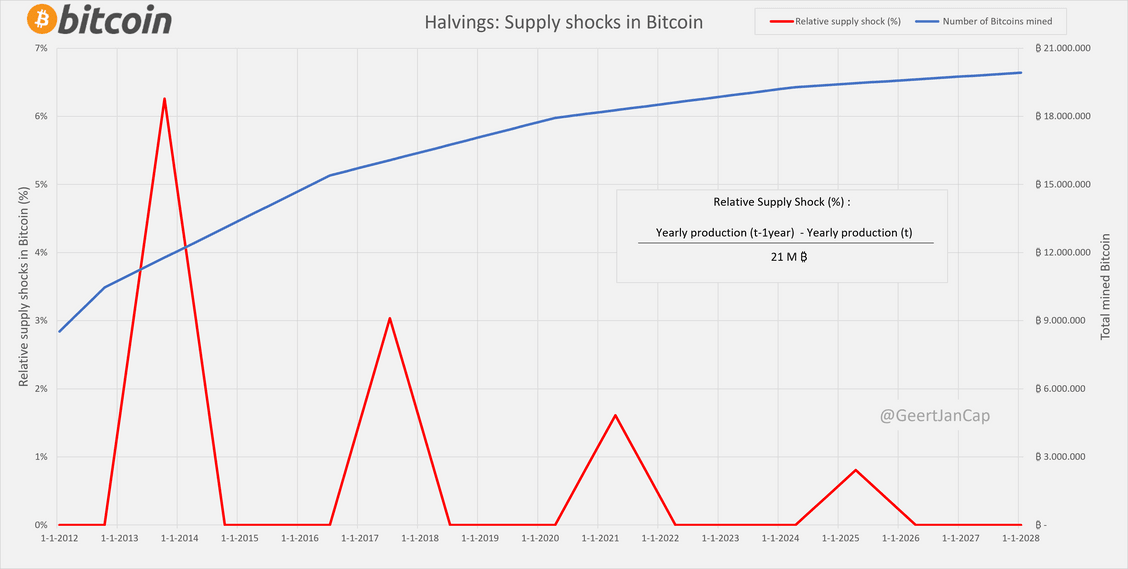
To begin with, we calculate year-over-year supply changes. We define supply shock as the change in annual year-over-year supply issuance relative to the final 21 million Bitcoin supply. At the halving of 2012, yearly production was reduced from 2.6 million to 1.3 million Bitcoin per year.
On a total of 21 million Bitcoin, that 1.3 million Bitcoin amounts to 6.2% of the total supply per year.
We chart this supply shock below in Chart 1 below.
Immediately following the first halving, the supply shock began to be felt, reaching its peak of 6.2% precisely one year after this halving and then declining back to 0% a full year later as the year-over-year change in newly mined coins per year returned to zero.
Four years later, in 2016, the next supply shock reduced the annual number of Bitcoins issued to 650,000 per year. This represents only 3.1% of the total 21 million coins per year or half the previous period’s supply shock.
Chart 1: Year-over-year issuance of Bitcoins
Chart 1 shows that the relative supply shock decreases by half following each halving. Since we define “supply shock” on an annual production basis, it takes a full year for it to reach its maximum and another year to return to zero.
2. Year-Over-Year Price Increases
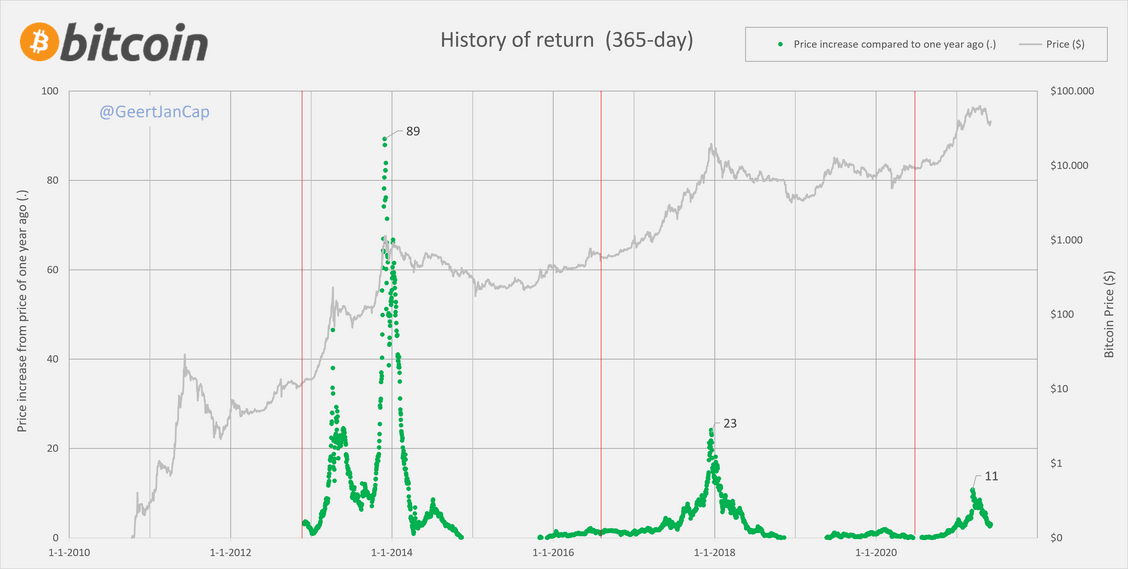
Having charted year-over-year issuance in Chart 1, we following chart year-over-year prices in Chart 2:
The year-over-year price multiple is plotted in green. These data points are created by dividing the price at a given date by the price one year earlier. For example, if the price is twice the price of that one year prior, a value of 2 is shown in the chart.
The red vertical lines indicate the halvings.
For reference Bitcoin’s actual price is also shown on a log scale in grey.
Chart 2: Year-over-year price increases
Despite foreknowledge of the halving-induced supply shocks, we see a shaping of the price of Bitcoin corresponding to the supply shocks, with year-over-year price multiples peaking twelve to eighteen months after the halving itself.
The shape is similar after each of the halvings but also clearly smaller in magnitude for each subsequent halving. This indicates a diminishing upward price reaction between subsequent halving cycles.
3. Comparing Supply Shock and Price Change Magnitudes Across Halvings
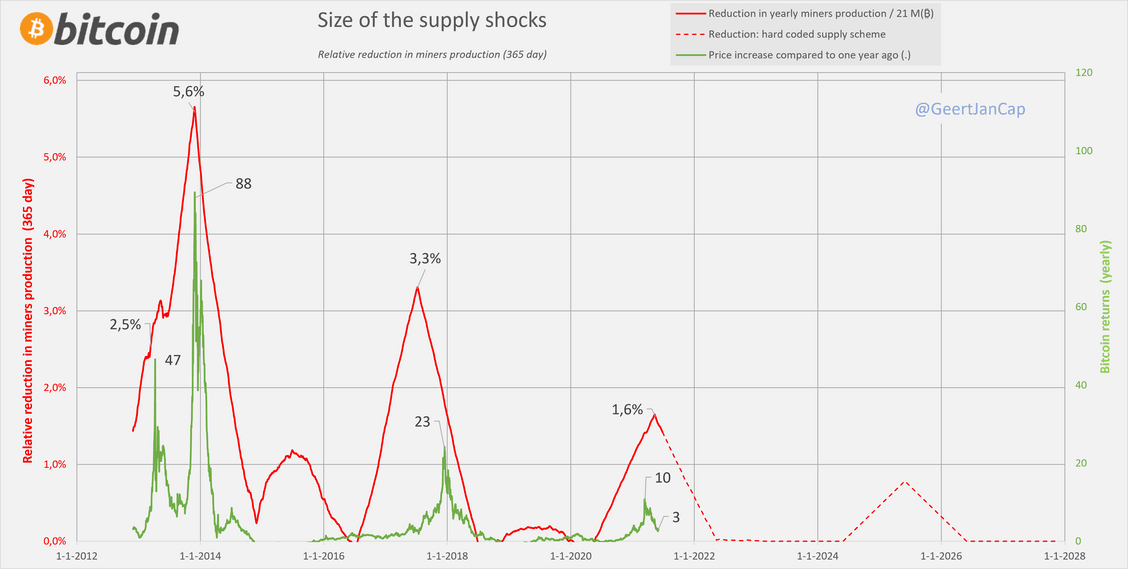
Next, in Chart 3, we compare the actual supply shocks with the actual year-over-year price variances.
First, chart 3 shows the year-over-year change in actual Bitcoin issuance in red. It still represents the size of the supply shocks relative to the total 21 million coin supply defined in Part 1.
Still, this plot differs slightly from the theoretical supply shock in Chart 1 due to variance in block discovery times that resulted from rapid changes in hash power, particularly between 2015 and 2016.
Secondly, the green plot reproduces the year-over-year price multiple changes from Chart 2.
We can observe that the magnitude of both of these plots is decreasing from one halving to the next and peaking at roughly the same time.
Chart 3: Size of the supply shocks
4. Comparing Troughs to Peaks Across Halvings
We now consider periods that span across halvings.
We compare the lowest price of the pre-halving boom-bust cycle, which we call the trough price, with the peak price achieved in the post-halving boom-bust cycle.
The boom-bust run of 2011 before the first halving saw Bitcoin reach a low of $2 after rising to $26 (no, this is not in thousands of dollars, just plain dollars).
After the first halving, the price rose to $1,100 in 2013. This was a 550-fold increase over the $2 low of the previous cycle’s trough.
The price then crashed back down to a trough of $200. After the second halving, the price peaked at $19,114 in 2017, a nearly 96-fold increase.
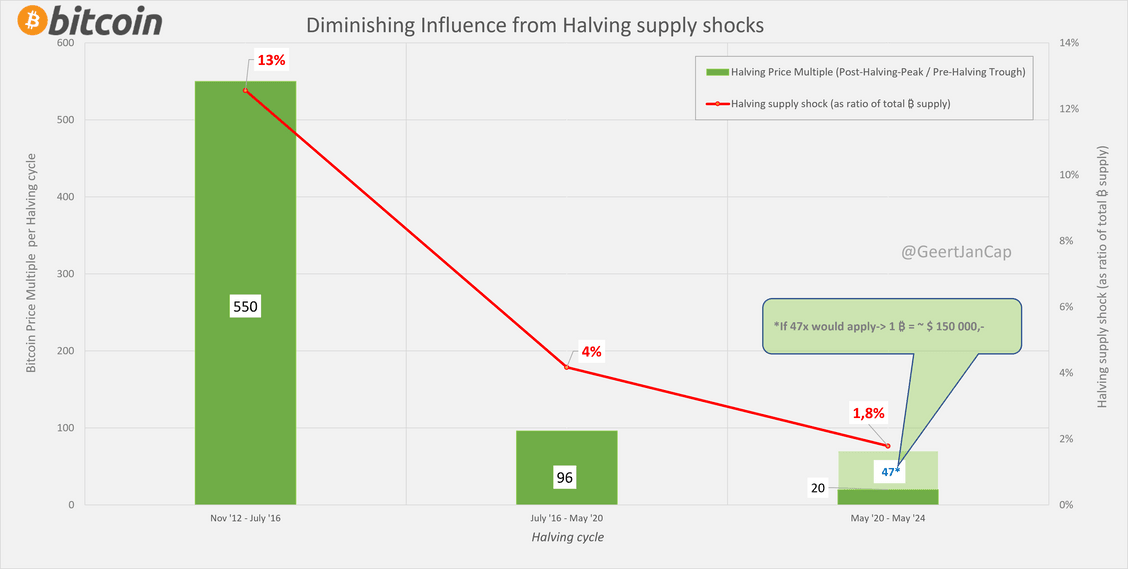
The price then crashed again to a trough of $3,150. The all-time high price following the third halving is $63,729, which represents a 20-fold increase so far.
We are not yet through this period, and Bitcoin may still achieve a higher price before the next halving. At the time of publication, we are 14 months into this halving period. Yet, even if Bitcoin were to reach a peak of $150,000 this cycle, it would still represent only a 47-fold increase compared to prior cycles’ 96-fold and 550-fold increases.
This analysis demonstrates decreasing upward price reaction from one halving cycle to the next.
Chart 4 below shows the peak returns across halving cycles, along with the peak halving supply shock in percentage terms.
The green columns represent how much the price rose from one cycle’s trough to the next cycle’s peak. The red number represents the ‘relative supply shock.’ Both can be seen to be diminishing from one period to the next.
Chart 4: Pre-halving trough to post-halving peak price multiples vs supply shocks
Conclusions
Supply shocks may indeed impact the shape and magnitude of the price of Bitcoin before and after each halving.
However, the percentage of new supply in terms of existing supply has reduced as the size of the shocks themselves has reduced in magnitude from one halving to the next.
As time progresses, supply shocks could thus be expected to play a much smaller role in Bitcoin’s price increases. We should expect lower halving-induced trough-to-peak changes in magnitude on Bitcoin’s price. Peaks will be smaller as the supply shocks themselves become smaller.
This implies that price changes will become principally and overwhelmingly driven by demand changes alone. Demand changes are not directly tied to halving cycles. This would thus lead to smoother, although still likely extremely high, returns for Bitcoin.
Swan IRA — Real Bitcoin, No Taxes*
Hold your IRA with the most trusted name in Bitcoin.
GeertJanCap
Mechanical Engineer R&D heavy and semicon industry, interested in disruptive technologies and (macro) economics.
Swan Guard brings world-class Bitcoin security with advanced risk controls, scam defense, and expert support — vigilantly protecting your Swan account and safeguarding your Bitcoin.
After managing a Swiss gold fund for 8 years, I realized Bitcoin surpasses gold as the ultimate store of value. Here’s why every gold investor should study Bitcoin closely.