Bitcoin looks a lot more rational when you look at the long-term logarithimic chart, especially as it relates to Bitcoin’s 4-year halving cycle.
Lyn Alden
Jan 7, 2021January 7, 20213 min read3 minutes read
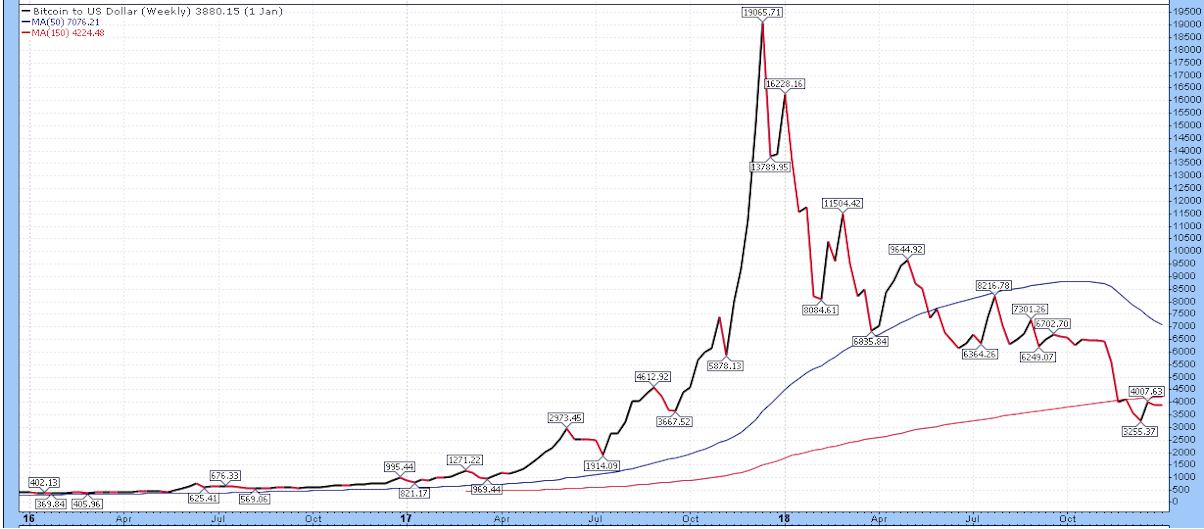
Many people view Bitcoin as a bubble, which is understandable. Especially for folks looking at the linear chart in 2018 or 2019, Bitcoin looked like it hit a silly peak in late 2017 after a parabolic rise that would never be touched again.
This linear price chart goes from the beginning of 2016 to the beginning of 2019 and shows how it looked like a classic bubble:
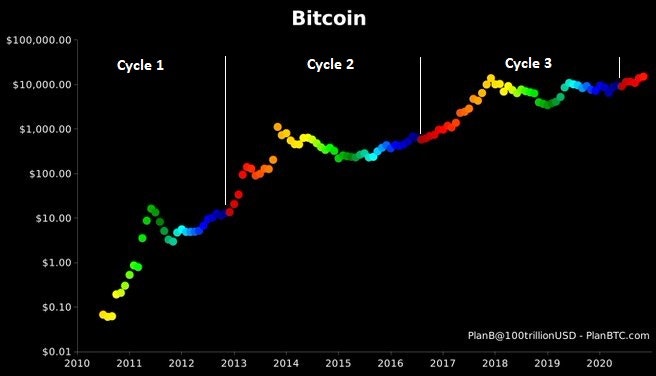
Maybe it is a bubble. We’ll see. However, it looks much more rational when you look at the long-term logarithmic chart, especially as it relates to Bitcoin’s 4‑year halving cycle.
Chart Source: Chart Source: PlanB @100trillionUSD, with annotations added by Lyn Alden
My job here is simply to find assets that are likely to do well over a lengthy period. For many of the questions/misconceptions discussed in this article, there are digital asset specialists that can answer them with more detail than I can. A downside of specialists, however, is that many of them (not all) tend to be perma-bulls on their chosen asset class.
This is true with many specialist gold investors, specialist stock investors, specialist Bitcoin investors, and so forth. How many gold newsletters suggested that you might want to take profits in gold around its multi-year peak in 2011? How many Bitcoin personalities suggested that Bitcoin was probably overbought in late 2017 and due for a multi-year correction?
I’ve had the pleasure of having conversations with some of the most knowledgeable Bitcoin specialists in the world, the ones that keep their outlooks measured and fact-based, with risks clearly indicated, rather than being constant promoters of their industry at any cost.
Bitcoin’s power comes in part from how enthusiastic its supporters are, but there is room for independent analysis on bullish potential and risk analysis as well.
And as someone who isn’t in the digital asset industry myself but who has a background that blends engineering and finance that lends itself reasonably well to analyzing it, I approach Bitcoin like I approach any other asset class; with an acknowledgement of risks, rewards, bullish cycles, and bearish cycles. I continue to be bullish here.
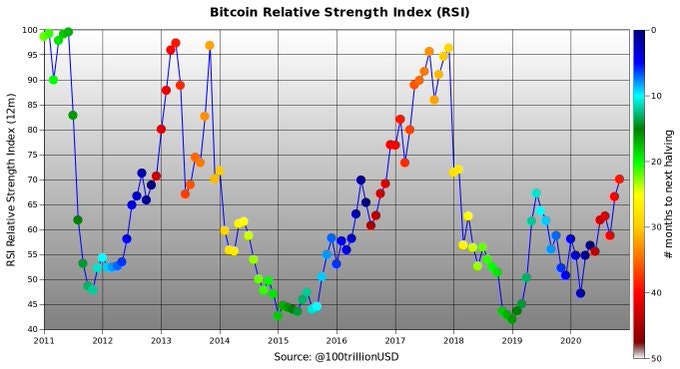
If this fourth cycle plays out anywhere remotely close to the past three cycles since inception (which isn’t guaranteed), Bitcoin’s relative strength index could become quite extreme again in 2021.
Here’s a chart from PlanB about Bitcoin’s historical monthly RSI during the bullish and bearish phases of its 4‑year halving cycle:
Chart Source: PlanB @100trillionUSD
For that reason, Bitcoin going from $6,900 to $15,000+ in seven months doesn’t lead me to take profits yet. In other words, a monthly RSI of 70 doesn’t cut it as “overbought” in Bitcoin terms, particularly this early after a halving event. I’ll likely look into some rebalancing later in 2021, though.
Each investor has their own risk tolerance, conviction, knowledge, and financial goals. A key way to manage Bitcoin’s volatility is to manage your position size, rather than try to trade it too frequently. If Bitcoin’s price volatility keeps you up at night, your position is probably too big. If you have an appropriately-sized position, it’s the type of asset to let run for a while, rather than to take profits as soon as it’s slightly popular and doing well.
When it’s at *extreme* sentiment, and/or its position has grown to a disproportionately large portion of your portfolio, it’s likely time to consider rebalancing.
Sign up to start saving Bitcoin
Buy automatically every day, week, or month, starting with as little as $10.
Lyn Alden
Lyn is an investment strategist at Lyn Alden Investment Strategy. She holds bachelor’s degree in electrical engineering and a master’s degree in engineering management, with a focus on engineering economics and financial modeling. Lyn has been performing investment research for over fifteen years in various public and private capacities.
Swan Guard brings world-class Bitcoin security with advanced risk controls, scam defense, and expert support — vigilantly protecting your Swan account and safeguarding your Bitcoin.
After managing a Swiss gold fund for 8 years, I realized Bitcoin surpasses gold as the ultimate store of value. Here’s why every gold investor should study Bitcoin closely.