


Swan Private Market Update #31
This Market Update report was originally sent to Swan Private clients on April 21th, 2023. Swan Private guides corporations and high net worth individuals globally toward building generational wealth with Bitcoin.
The markets are filled with uncertainty and confusion today. If you read the headlines, one analyst is predicting doom is around the corner, while another is claiming that a new bull market has begun. This stems from the fact that assets like equities and Bitcoin have exploded upwards to begin the year, and yet many economic metrics are still showing signs of weakness. There are compelling arguments for why it may be prudent for investors to exhibit some caution here, but at the same time, this is how all bull markets begin — they climb a wall of worry. This has left market participants scratching their heads and wondering, “Is this rally for real?” Let’s look at the data to discern some of the bullish and bearish arguments for where markets will move forward from here.
This Market Update report was originally sent to Swan Private clients on April 21th, 2023. Swan Private guides corporations and high net worth individuals globally toward building generational wealth with Bitcoin.
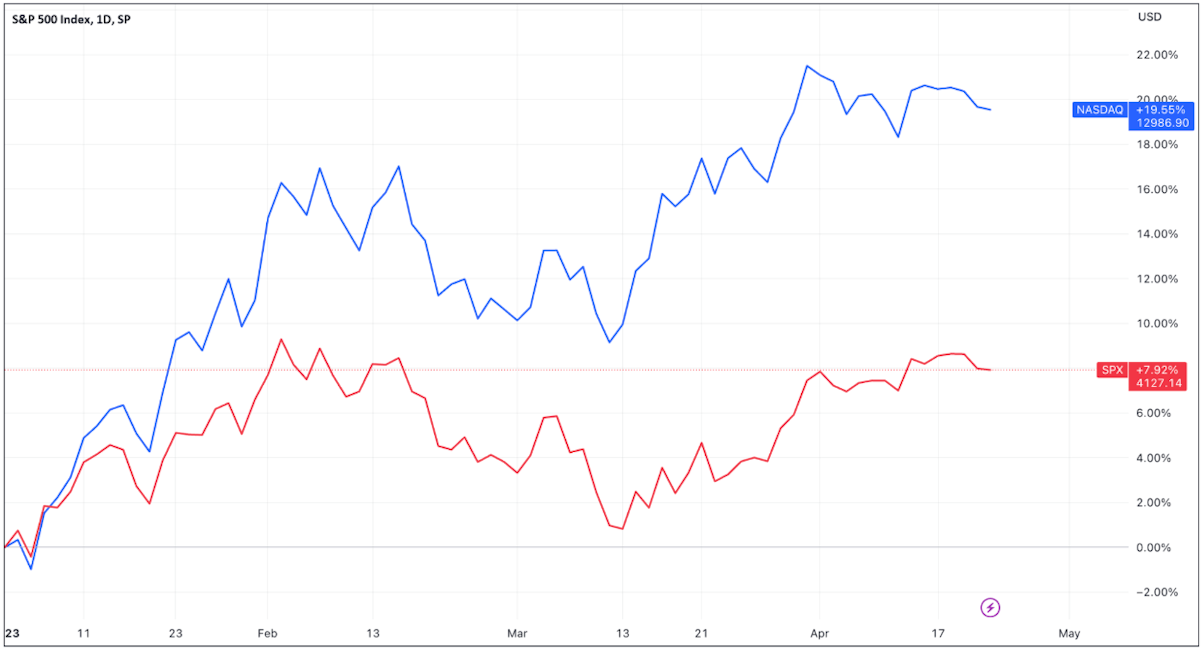
The rise in equities has been nothing short of breathtaking given the macroeconomic backdrop. The S&P 500 is up +8.6% YTD, off only 13.9% from its all-time high in December 2021. Similarly, the Nasdaq is up +20.1% YTD, off a mere 20.5% from its all-time high.
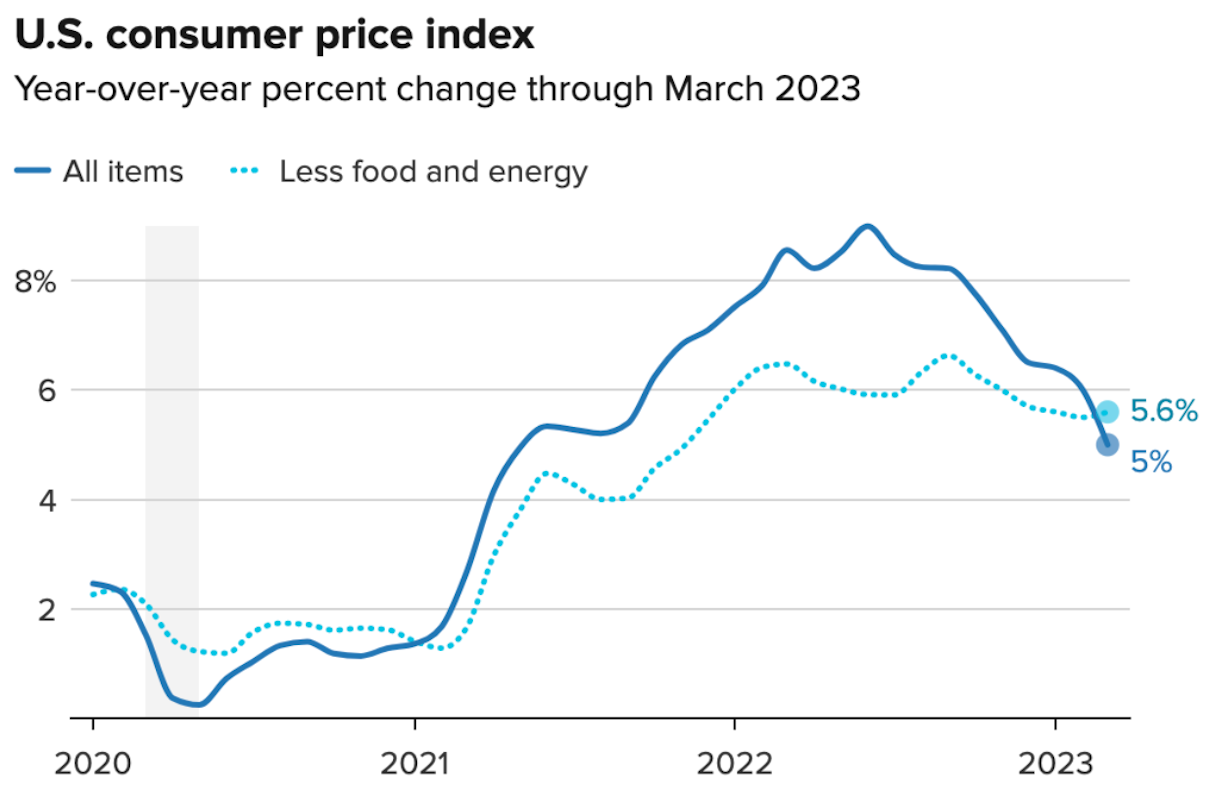
The rally in U.S. equities can be attributed to many factors, one of which is that we are continuing to see reductions in inflation. Headline CPI inflation came down again last month and now sits at 5% YoY.
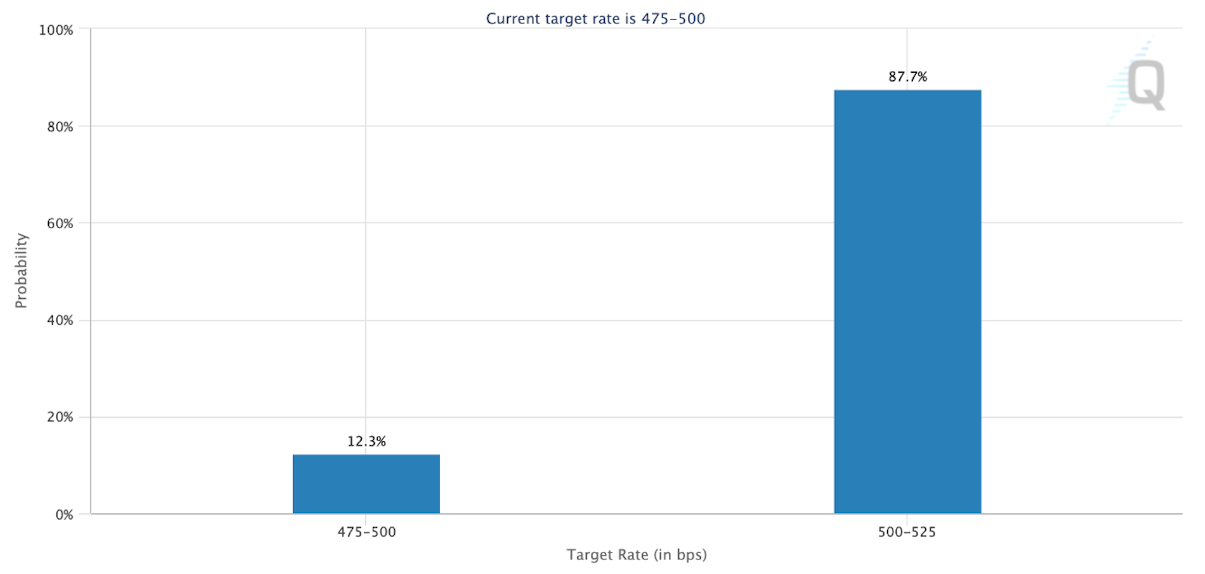
The markets appear to have taken this recent decline in CPI as a sign that this would result in the Fed doing one more 0.25% rate hike next meeting and then pausing from there. The market is pricing in a 87.7% probability of a 0.25% rate hike at the Fed’s next FOMC meeting on May 3rd.
Assets considered “risk-on” have rallied after the inflation print and could be attributed to market participants thinking that the Fed’s tightening cycle will soon be at an end. However, it makes one wonder if markets are pricing this correctly?
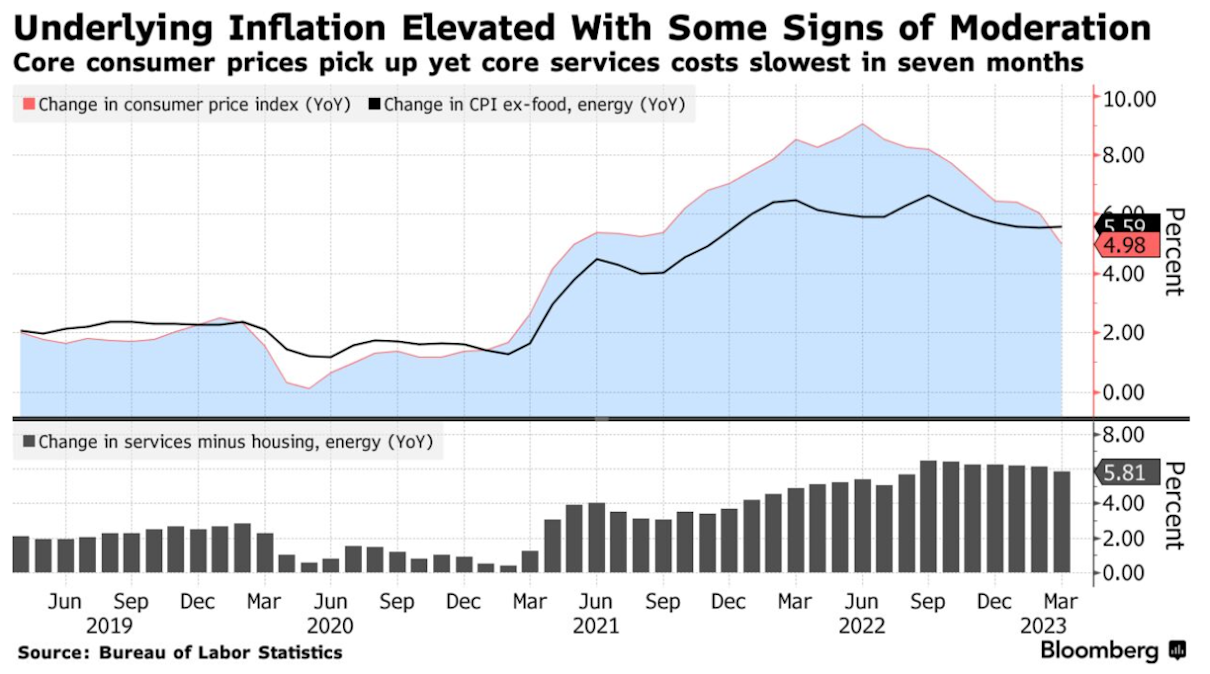
Speeches from various Federal Reserve officials imply that they continue to be focused on bringing inflation down and have not seen the progress in core inflation that they would like to see yet. Core CPI (ex-food and energy) still remains elevated compared to headline CPI.
Fed Governor Christopher Waller said in a speech on April 14th,
“Since December of 2021, core inflation has basically moved sideways with no apparent downward movement. So, despite some encouraging news on a slowing in housing costs, core inflation does not show much improvement and remains far above our 2 percent inflation target…I would welcome signs of moderating demand, but until they appear and I see inflation moving meaningfully and persistently down toward our 2 percent target, I believe there is still work to do.”
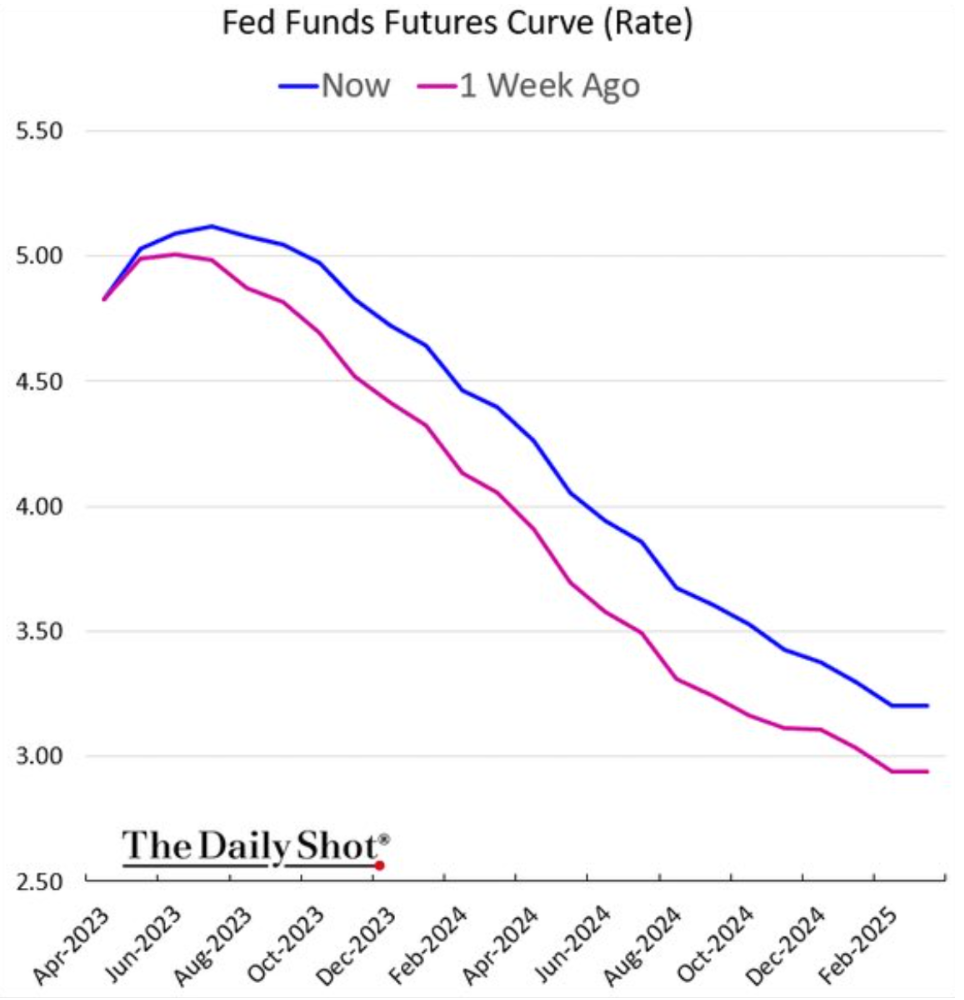
This statement indicates that the Fed is still laser-focused on bringing inflation down and is not yet satisfied with where inflation sits today. This is starting to be reflected in the implied Fed Funds Futures curve, which has changed over the last week, and is now showing “higher for longer” in terms of market expectations for interest rates moving forward. Markets are now only predicting 1-2 rate cuts at the end of the year.
The Fed is signaling that they are not done slaying the inflation beast just yet, and the last Fed meeting minutes showed that Fed officials discussed the probability of a “mild recession” starting later this year, with a recovery in 2024-2025. This was the first time to my knowledge that Fed officials openly included the “R-word” in the meeting minute transcripts.
Calls of a recession in the later half of the year have become a common utterance amongst institutions and analysts alike. Part of this could be due to the fact that there is a confluence of factors that are all lining up around that time that could be a headwind for asset prices.
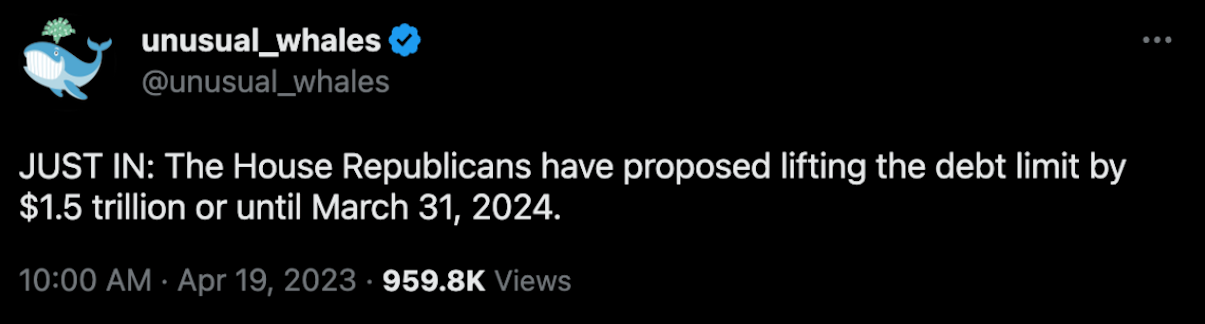
With the debt ceiling expected to be resolved around late Summer or early Fall, the Treasury General Account (TGA) is refilled with tax receipts and the sale of newly issued debt. Already House Republicans are proposing to lift the debt limit.
The debt ceiling has always been more political theater than anything because if Congress does not vote to raise the debt ceiling then the US will default, and they can’t have that.
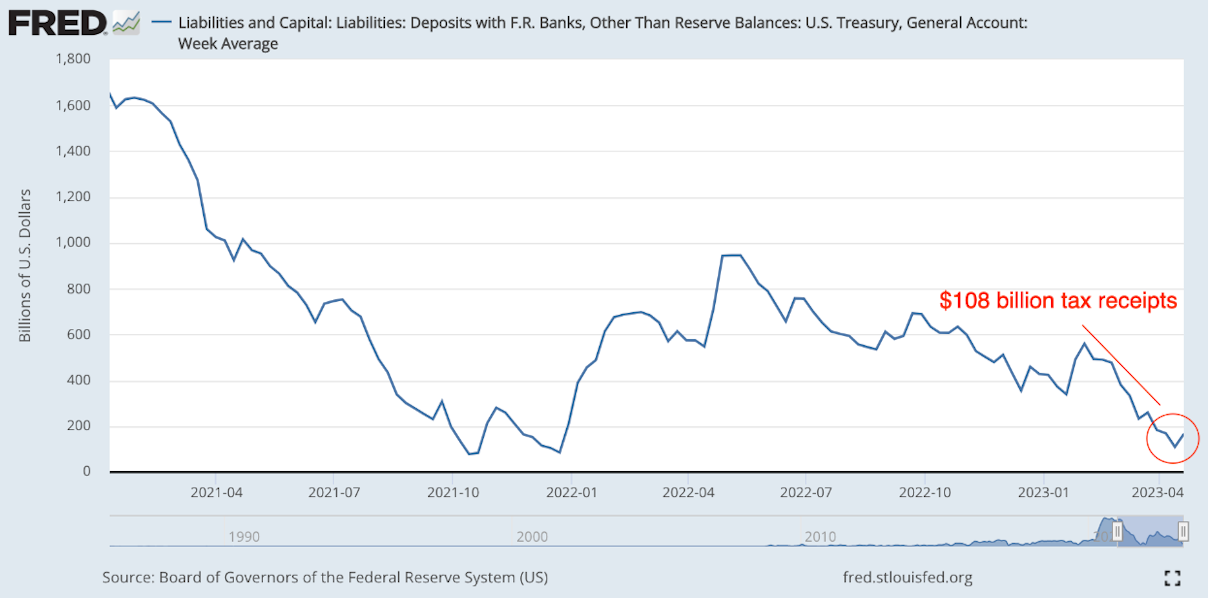
When cash leaves the TGA, bank reserves increase, which has the secondary effect of increasing lending and investment in the economy. Thus, a falling TGA account indicates increased liquidity in the system.
This is what we have observed this past year. The TGA has been drained and has likely contributed to the rise in asset prices. A draining of the TGA helped improve liquidity conditions and offset the Fed’s Quantitative Tightening over that same time period.
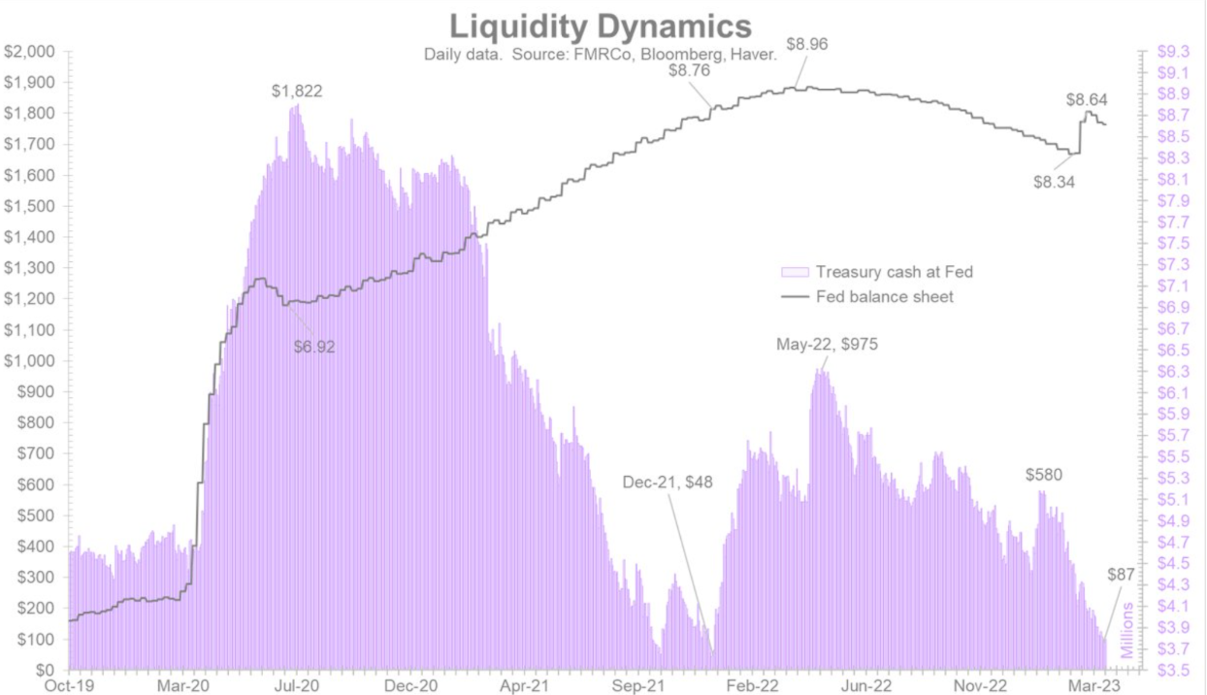
But now the TGA is close to being drawn down. The TGA will get refilled with incoming tax receipts and with newly issued Treasury debt when the debt ceiling is inevitably lifted. As the TGA gets refilled, it results in liquidity getting sucked out of the system. This liquidity drain will come as the Fed has made no hint that it will stop reducing its balance sheet via quantitative easing. Jurrien Timmer highlights these liquidity dynamics in the chart below.
Barring no significant changes to monetary policy or some unforeseeable Black Swan event, these dynamics will likely result in decreased liquidity conditions around Q3 of this year, which could be a headwind for the financial system and for asset prices.
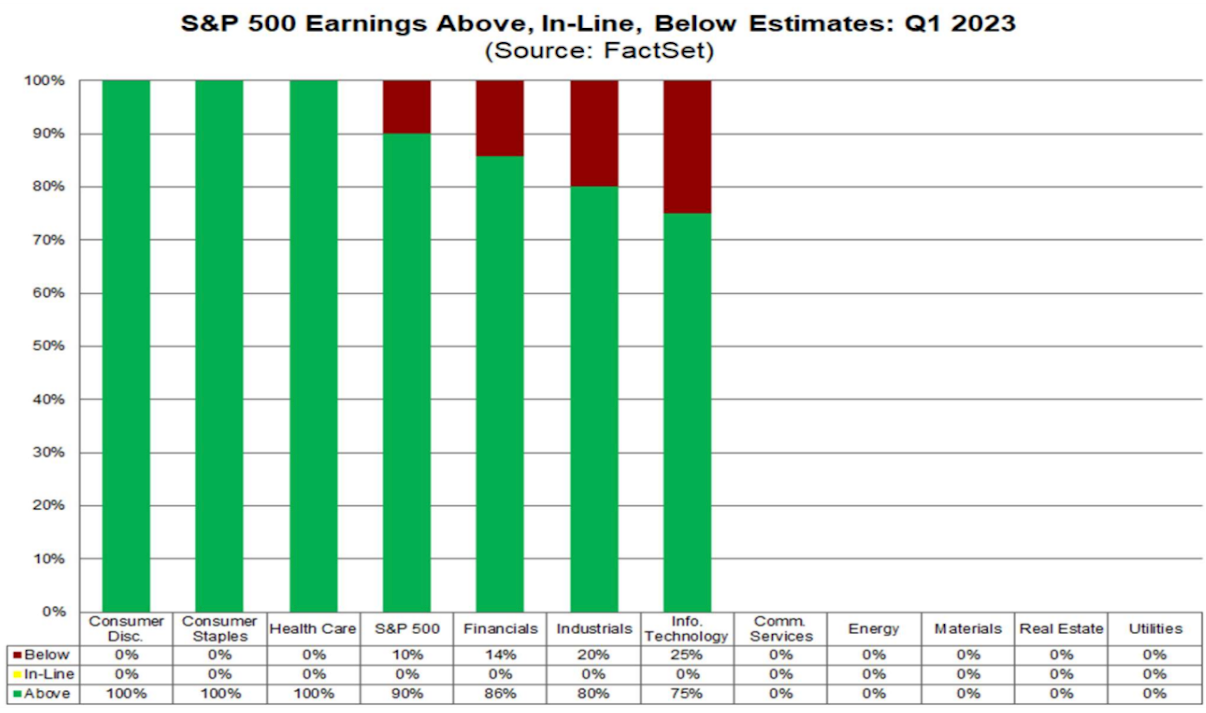
One reason that equities may have performed well through the first quarter of 2023 is earnings broadly came in above estimates. For Q1 2023, 90% of the S&P 500 companies that reported had a positive Earnings per Share (EPS) surprise and 63% of S&P 500 companies have reported a positive revenue surprise.
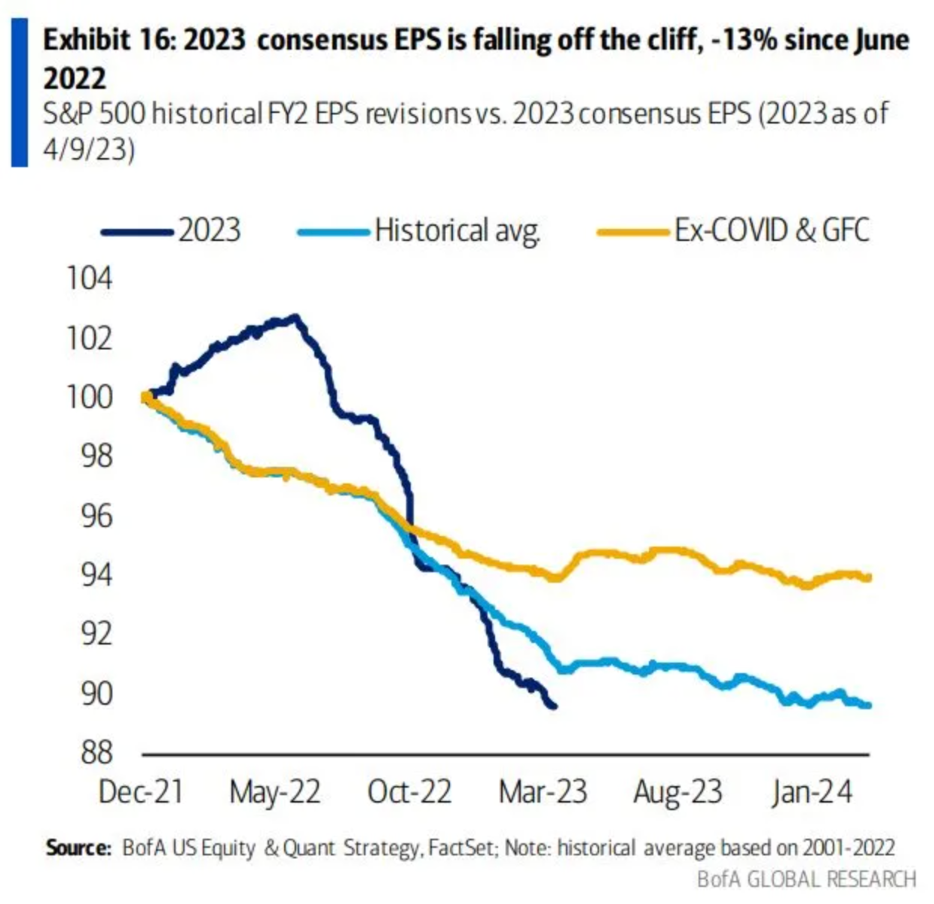
Since the surprise earning season of Q1, consensus EPS estimates are continually being revised downward.
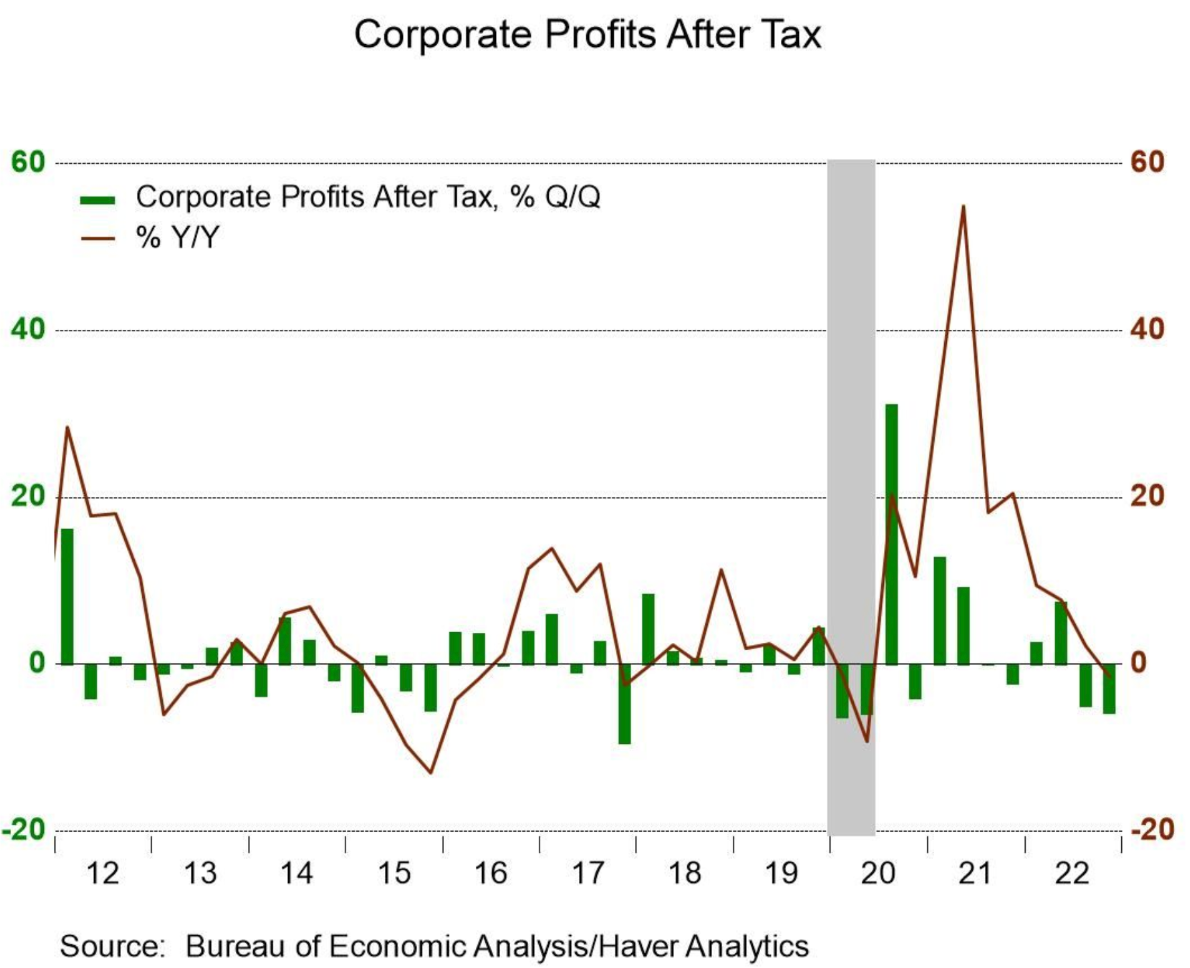
Analysts are starting to ascribe a greater probability to a drop in corporate earnings. We are already seeing corporate profitability start to roll over. Corporate profits after tax have dropped into negative territory year-over-year.
This coming earnings season will be watched closely to see if they come in under estimates due to rising costs from the elevated levels of inflation or reduced demand from consumers. Which brings us to…
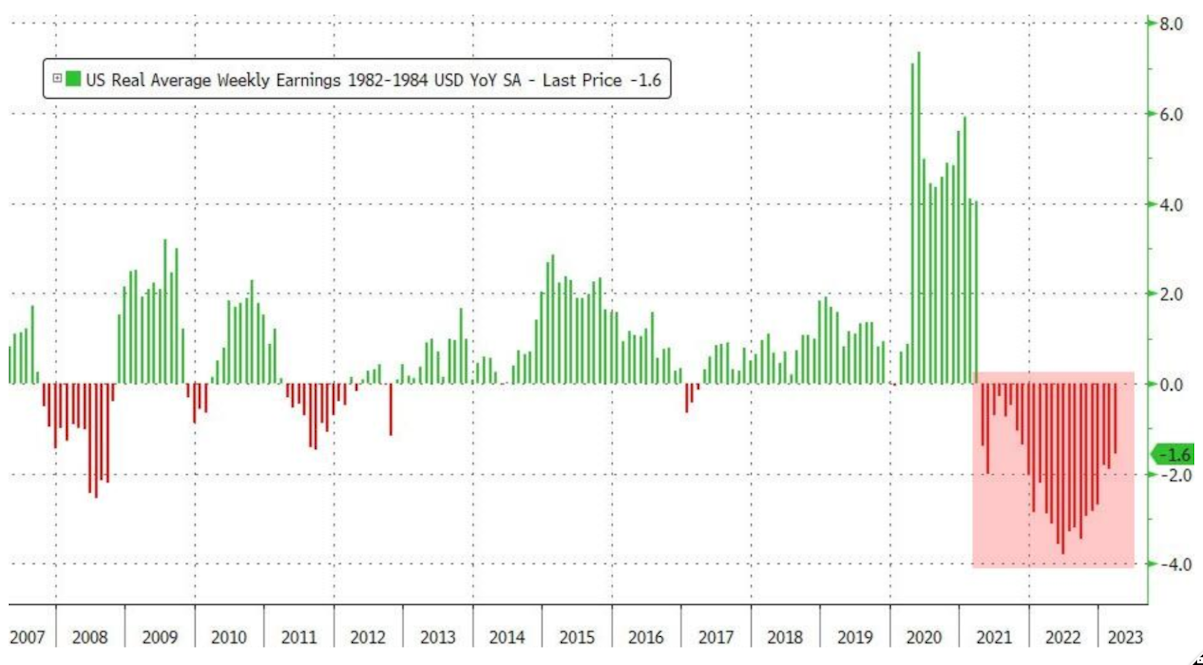
The consumer has been under constant bombardment during this period of high inflation eating into their incomes. Real wages have declined for 24 consecutive months! And keep in mind this is based on the official CPI calculations, which are used to adjust earnings to arrive at a supposedly “real” figure.
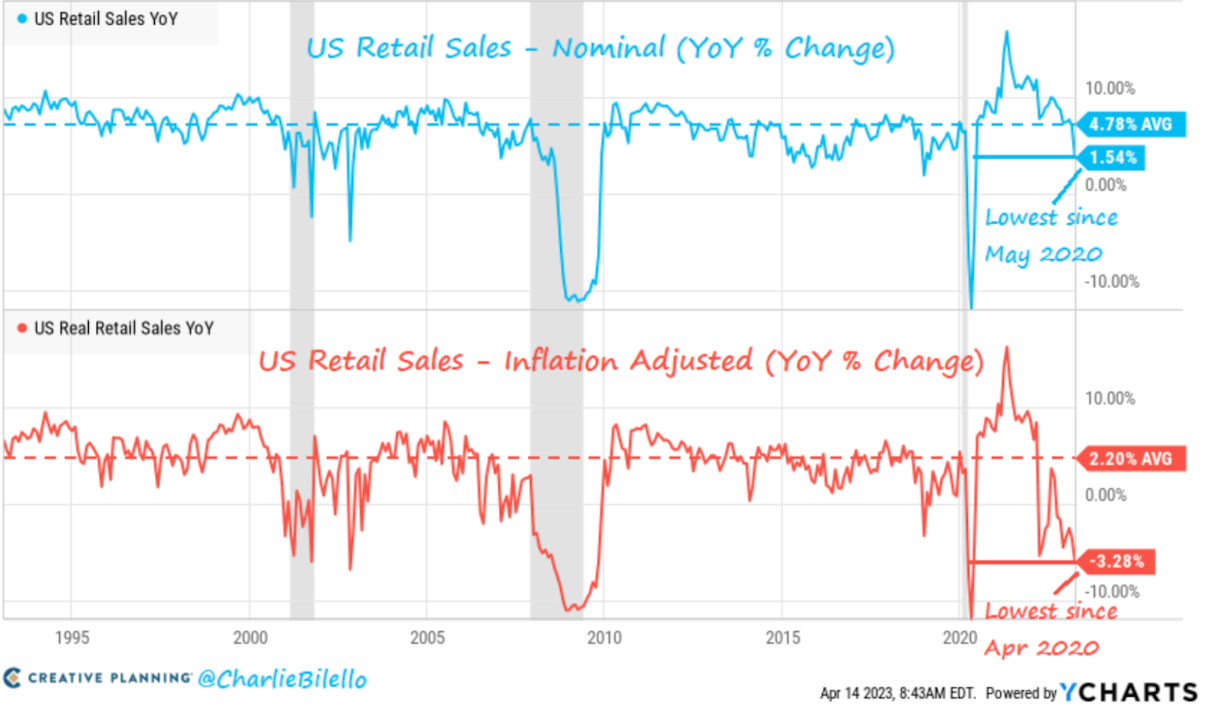
Consumers are definitely starting to feel the pain. This was evident with the recent retail sales data which disappointed greatly to the downside. Charlie Bilello shows how the inflation-adjusted retail sales is down -3.28% YoY, the lowest level since April 2020
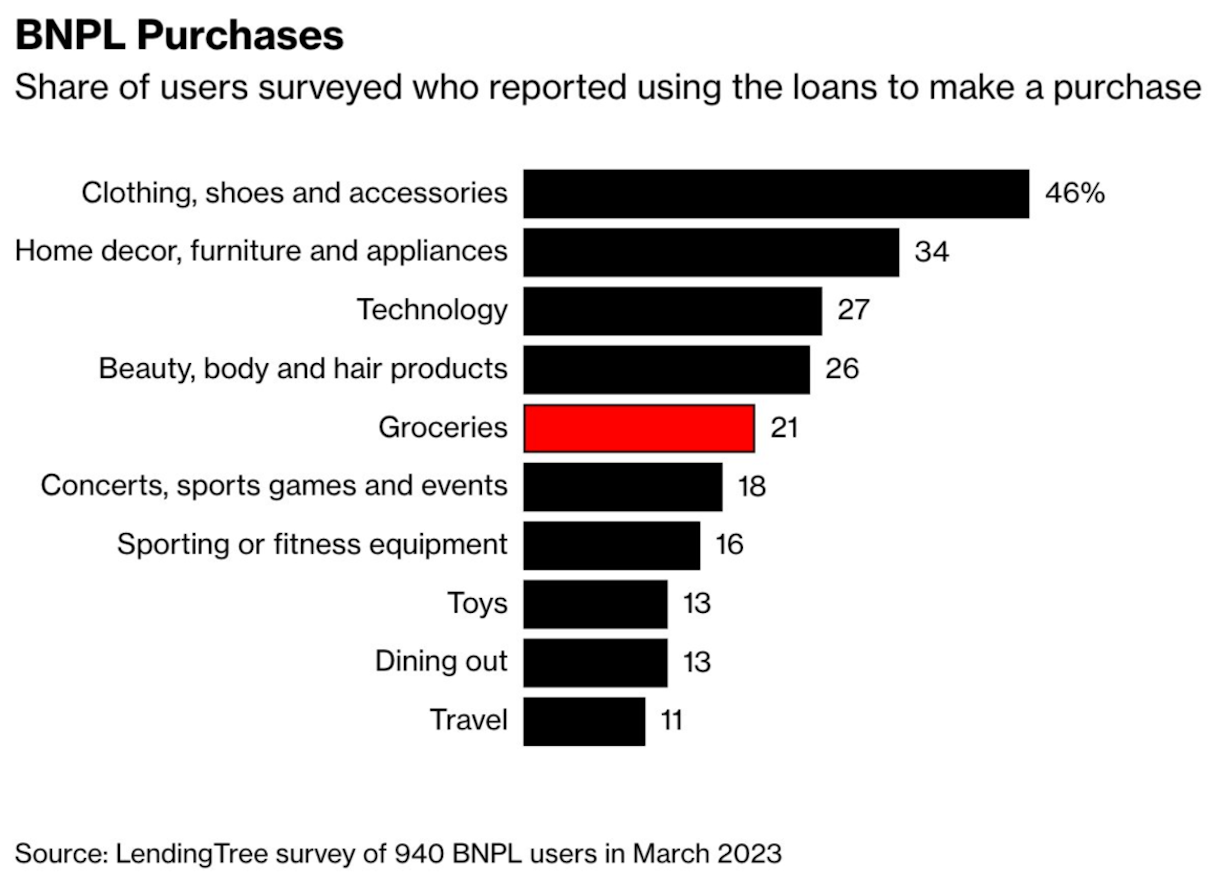
Individuals are starting to turn to “Buy Now, Pay Later” apps to make ends meet. These are apps that allow people to take out short-term loans to buy things like essentials. In a recent survey, nearly half of Americans who responded stated they have used Buy Now, Pay Later apps, and 1 in 5 said they rely on such apps to buy groceries.
If we continue to see weakness at the consumer level, this could eat into the corporate earnings mentioned above, which could be a drag on economic growth, and lead to a decline in asset prices.
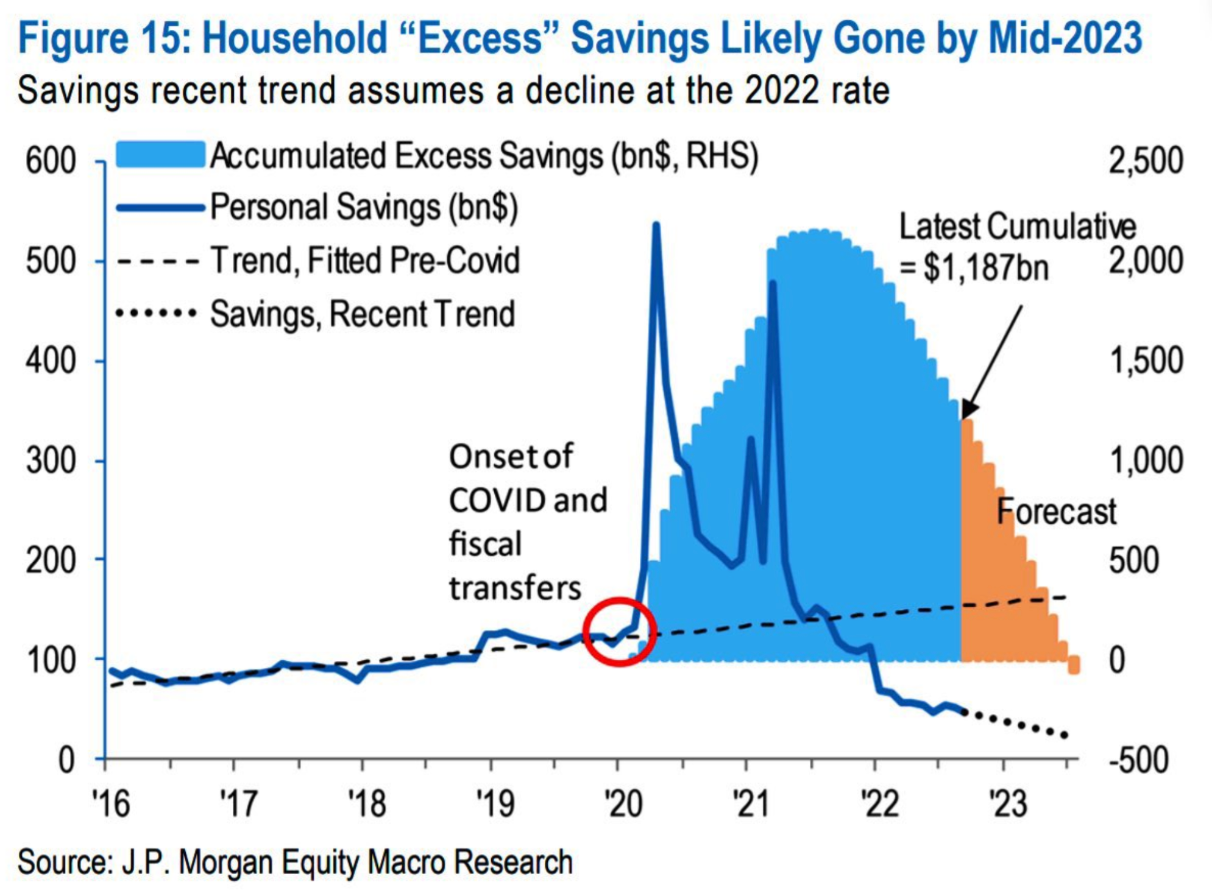
Part of the reason consumers have remained strong up to this point is there is still a lot of excess savings in the system as a result of the various accommodative pandemic programs. However, if the current trend holds, these cumulative savings are set to run out by mid-2023.
All of these findings suggest that consumers are getting squeezed, and are surviving by reducing their savings and resorting to alternatives like Buy Now, Pay Later apps to stay afloat. If the inflation data continues to decrease from here, this could give the consumer much needed relief and could keep the consumer from cutting back spending, which ultimately would be beneficial for businesses and asset prices.
With the drain in excess savings expected to occur by late summer, liquidity expected to get drained around the same time, earnings expected to get hit, and the Fed continuing to stay hawkish, all of this points towards the end of summer and early fall as being an important point in time for the future direction of markets. All of these factors could change with time, but being aware of them could help investors position themselves prudently and mentally prepare for all potential scenarios in the short to medium-term.
Bitcoin has always marched to the beat of its own drum. Quite frankly, there is no other asset in the world with the value proposition of Bitcoin. As both a digital store of value that functions outside the traditional financial system, and a new innovative technology, it has the unique ability to offer both safety and potential outsized gains as its adoption continues.
This was never more apparent than during the recent banking crisis. Bitcoin’s price spiked as the traditional financial system appeared more unstable than it had in years. This was perhaps due to investors realizing that they had to hedge the counterparty risk that is pervasive in most other asset classes. Bitcoin is an asset that lacks counterparty risk, so it seems like the perfect asset for investors to diversify into.
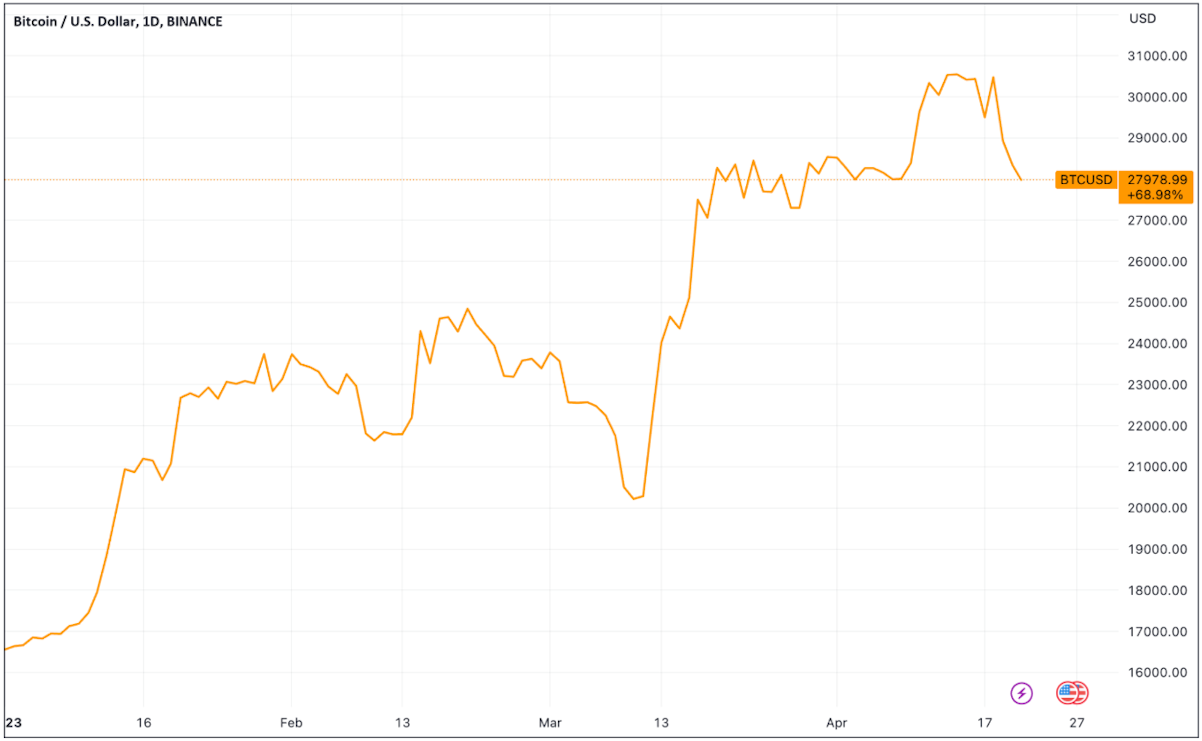
Bitcoin has rallied harder than any asset class to begin the year. It has exploded upwards to the tune of +68.9% to start 2023.
To know for sure whether or not Bitcoin will go up or down in the short-term is always a fool’s game, but what we can do is learn from previous bear markets about what to expect to see around a bear market bottom.
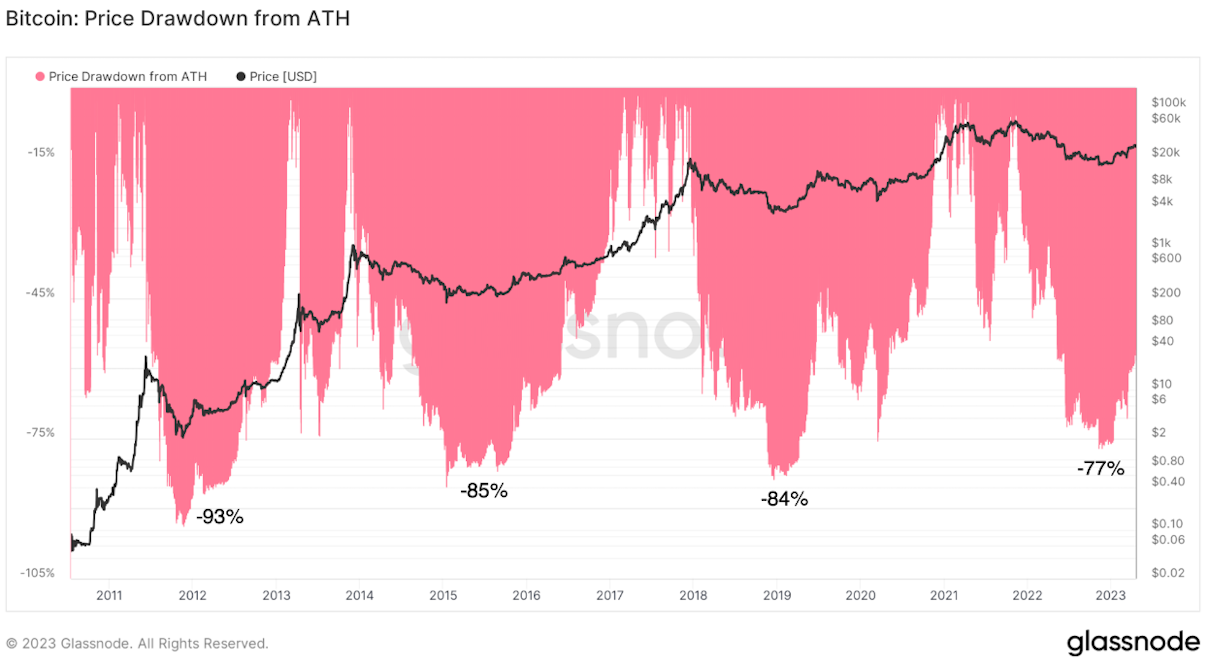
The first sign is that Bitcoin ended down -77% from its all-time high in November 2022. This was consistent with drawdowns of previous bear markets.
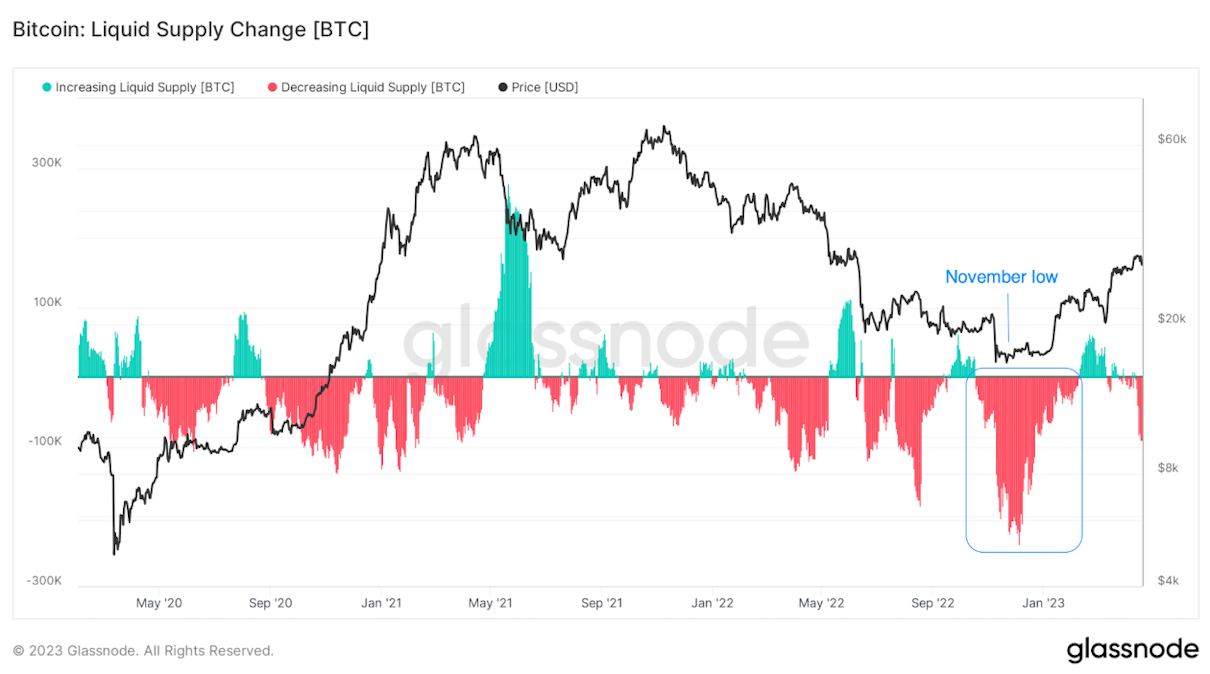
During this time we saw speculators sell their coins to addresses that have since not sold. These speculators likely were holding Bitcoin for short-term gains and were shaken out during the chaotic 2022 when various crypto companies like FTX, Celsius, Voyager, Three Arrow Capitals, and BlockFi went under. Typically in bear markets, we see a shift of coins from weak hands to strong hands and this was most evident when Bitcoin dropped under its previous all-time high of $20,000. When the price dropped below this level, over 200,000 BTC moved to entities considered long-term holders.
Note that this metric also counts bitcoin’s maturing after 6 months of being held, but the degree to which the coins moved below those prices indicates that there was substantial movement of bitcoin from weak hands to strong hands.
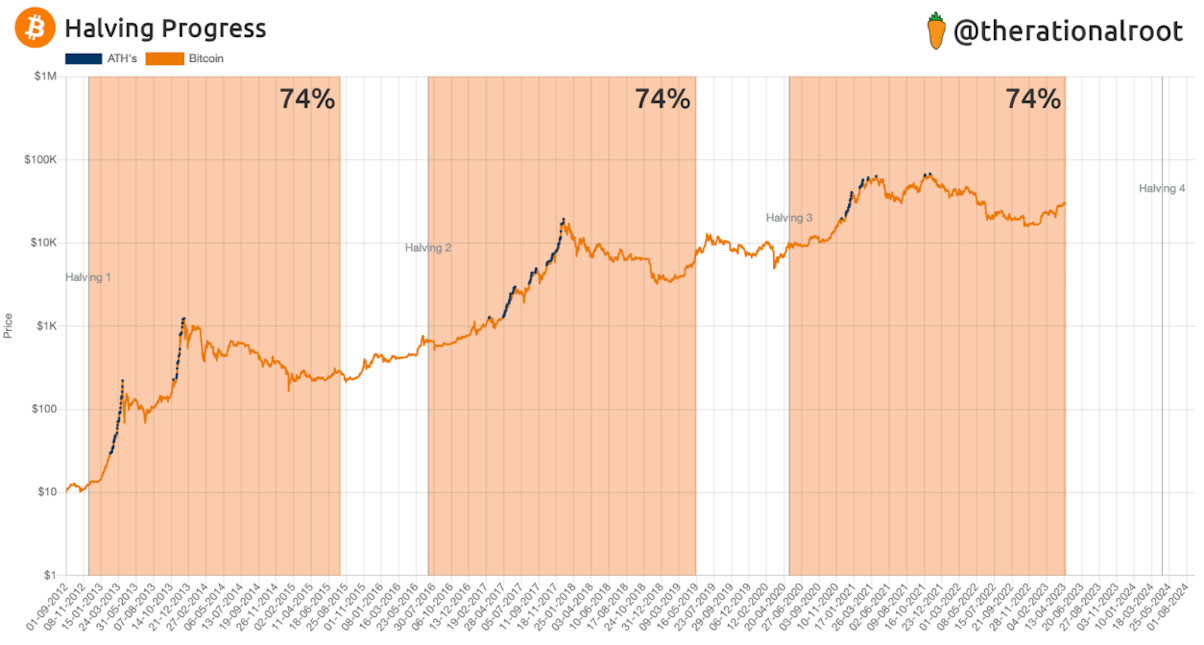
After the short-term speculators sold their coins, Bitcoin has been off to the races back towards its all-time highs. This coincides with the halving about one year away. As it stands today, we are about 74% through this halving epoch.
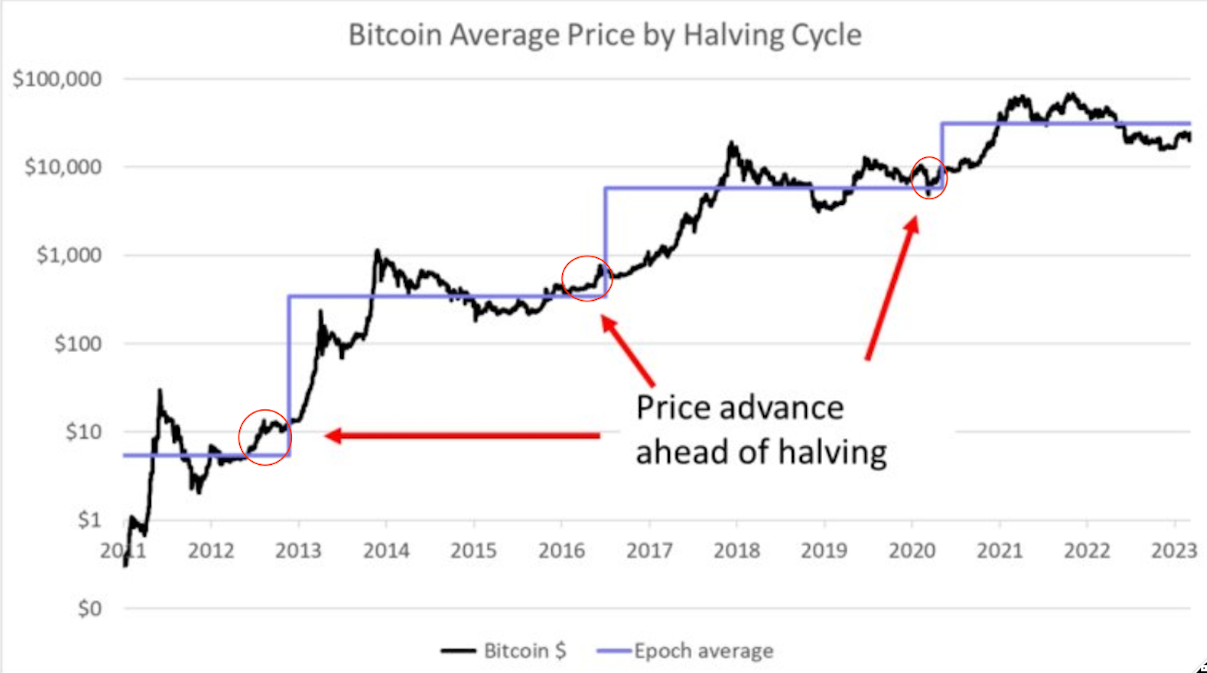
Historically, Bitcoin has rallied before a halving event, as shown in the chart below.
Now this only looks at the supply side of the equation. The price ultimately depends on demand for Bitcoin increasing as well. But markets are forward looking, and many participants view this as an important event. As a result, the lead up to the halving could result in an anticipatory tailwind for the price of Bitcoin like it has in the past. This is especially true when we consider that demand for a scarce, decentralized money that functions outside the banking system has never been more apparent to many investors. After the banking crisis, many are waking up to Bitcoin’s value proposition. It is clear that the demand has been high for Bitcoin in 2023 thus far. Let’s see if it continues.
Bitcoin ultimately benefits from the return to accommodative monetary policies. Demand for an asset that has absolute scarcity will explode in the event that the Federal Reserve needs to go back to Quantitative Easing and/or Congress decides to hand out more stimulus checks in the event of an economic downturn.
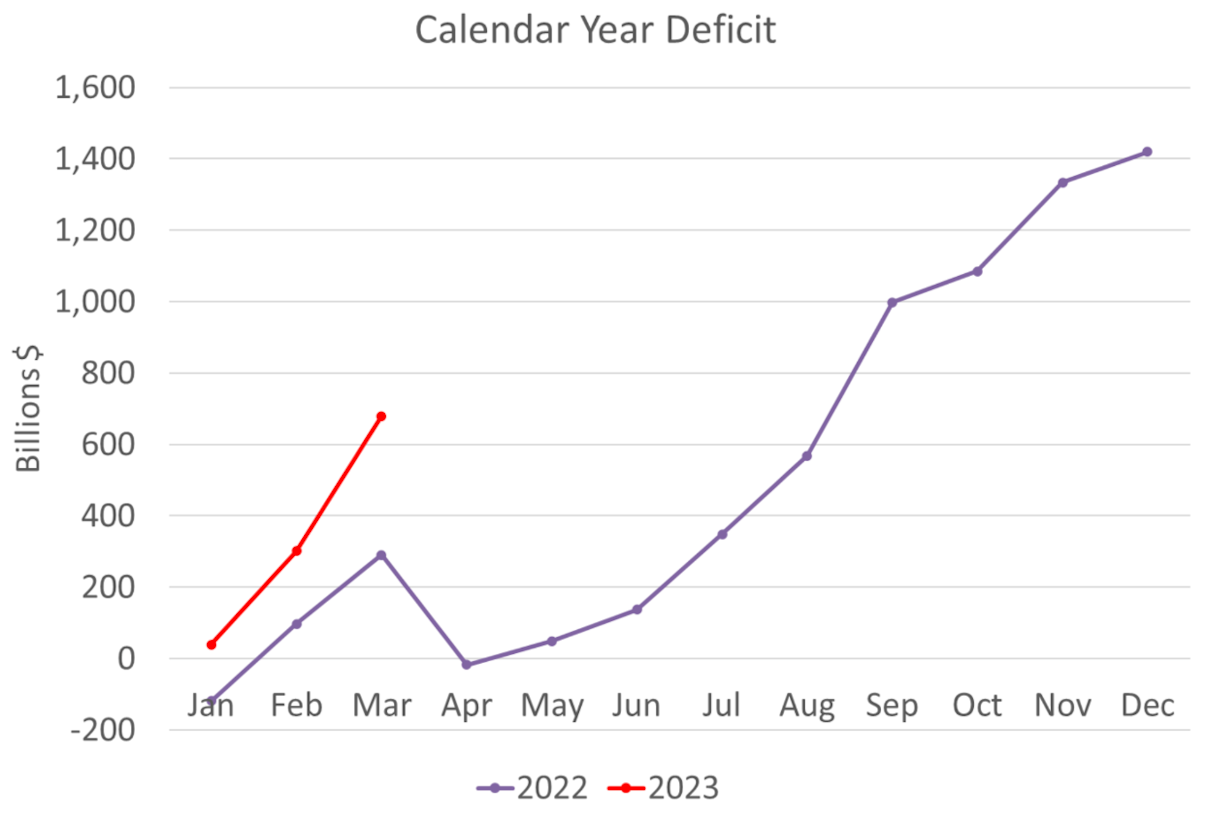
This seems to become more likely when you consider the deficit and the unsustainable nature of the US debt burden. The 2023 deficit has absolutely exploded to start 2023, up a massive $679 billion in the first quarter alone. This is an increase of over 134% compared to 2022.
So while the Fed talks a big game about fighting consumer price inflation, it’s important to remember that inflation is ultimately needed to reduce the burden of US government debt from a debt-to-GDP perspective.
With interest rates rising at their fastest pace in history, the interest expense on the US public debt increased to a record high of $812 billion over the past year. If this trend continues to increase at the current rate, it will soon be around $1 trillion, surpassing Social Security as the biggest expense. When we consider the decline in tax receipts and the ballooning expense of the interest on the public debt, it becomes clear that this is unsustainable.
It seems likely that the Treasury in conjunction with the Federal Reserve will eventually have to resort to cutting interest rates to reduce the interest expense on the debt or else risk a default. In other words, there will be pressure on the Fed to go back to QE. In that event, Bitcoin will benefit just like it did in March 2020. Given markets are forward-looking, and Bitcoin has been a leading indicator over the past several years, perhaps Bitcoin is already sniffing out this probable scenario. This could justify some of the price increases we have seen. We can only wait and see how this debt spiral will play out.
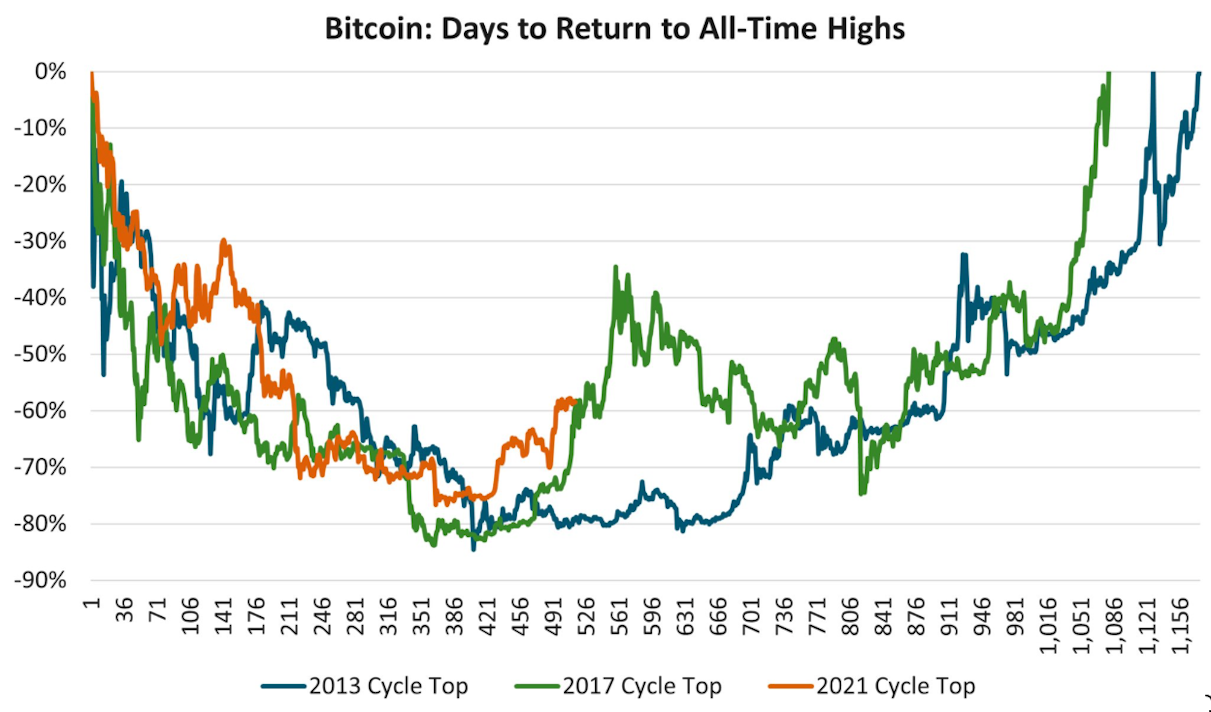
All in all, Bitcoin has rallied off a low and has regained significant price momentum. When comparing the current price action to previous market tops, and specifically looking at how long it took for the price of Bitcoin to return to all-time highs, we are right near the beginning of it today.
We should expect Bitcoin’s rally back to its all-time high to be full of peaks and troughs and for it to take >1,000 days if the price moves similar to previous cycles. The macroeconomic backdrop remains highly uncertain and volatility should be expected moving forward. There are several macroeconomic factors converging around Q3 that investors would be cautious of, but right now Bitcoin is soaring. Bitcoin is climbing a wall of worry, and like all beginnings of bull markets, it is leaving investors in disbelief.
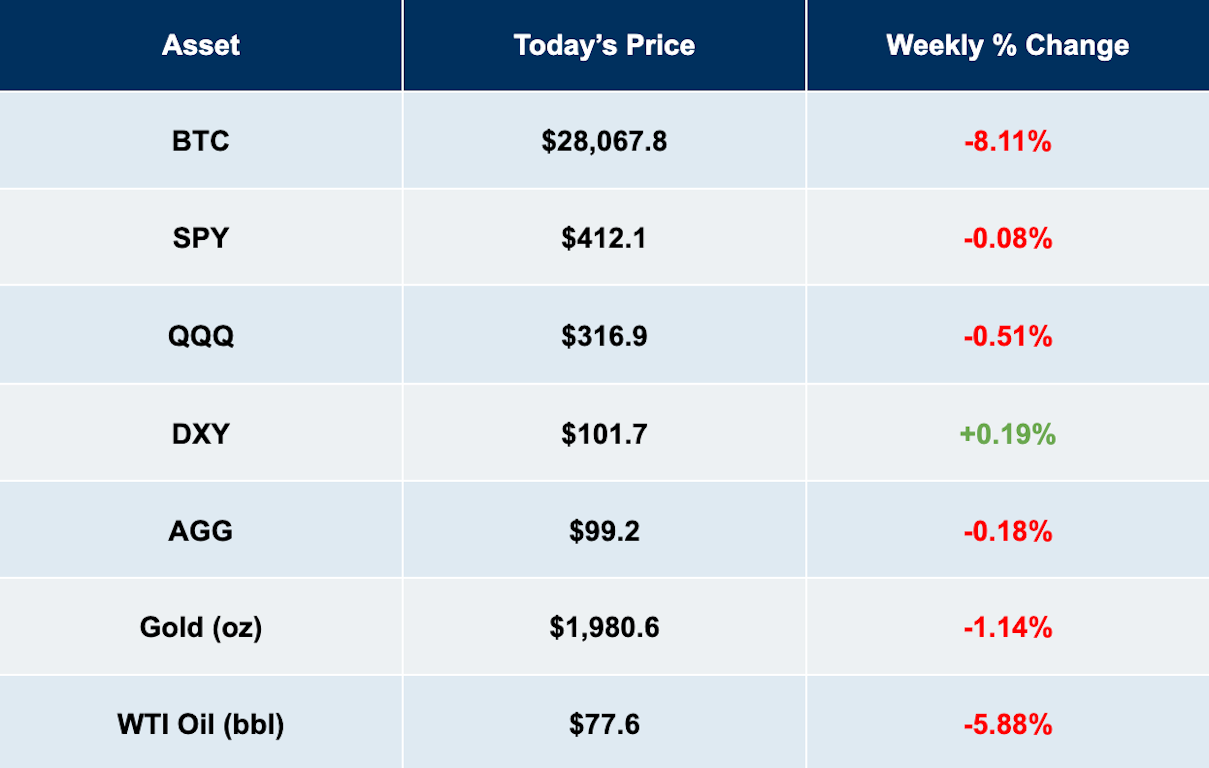
Market Overview
Hold your IRA with the most trusted name in Bitcoin.
Sam Callahan is the Lead Analyst at Swan Bitcoin. He graduated from Indiana University with degrees in Biology and Physics before turning his attention towards the markets. He writes the popular “Running the Numbers” section in the monthly Swan Private Insight Report. Sam’s analysis is frequently shared across social media, and he’s been a guest on popular podcasts such as The Investor’s Podcast and the Stephan Livera Podcast.
News
More NewsThoughts on Bitcoin from the Swan team and friends.
The credit-based traditional financial system is built on trust, and right now, that trust is breaking down in a world where trustless digital money exists.
There are lots of words to describe the last week when it comes to the traditional financial system, but orderly is certainly not one of them.