


Swan Bitcoin Market Update #46
This Insight Report was originally sent to Swan Private clients on December 8th, 2023. Swan Private guides corporations and high net worth individuals globally toward building generational wealth with Bitcoin.
This Insight Report was originally sent to Swan Private clients on December 8th, 2023. Swan Private guides corporations and high net worth individuals globally toward building generational wealth with Bitcoin.
In his post-FOMC speech a few weeks ago, Jerome Powell mentioned that Federal Reserve officials were now discussing the possibility of rate cuts, and markets went wild.
Since then, the market has enjoyed an “everything rally” as investors took the Fed messaging as a green light to go long heading into the holidays.
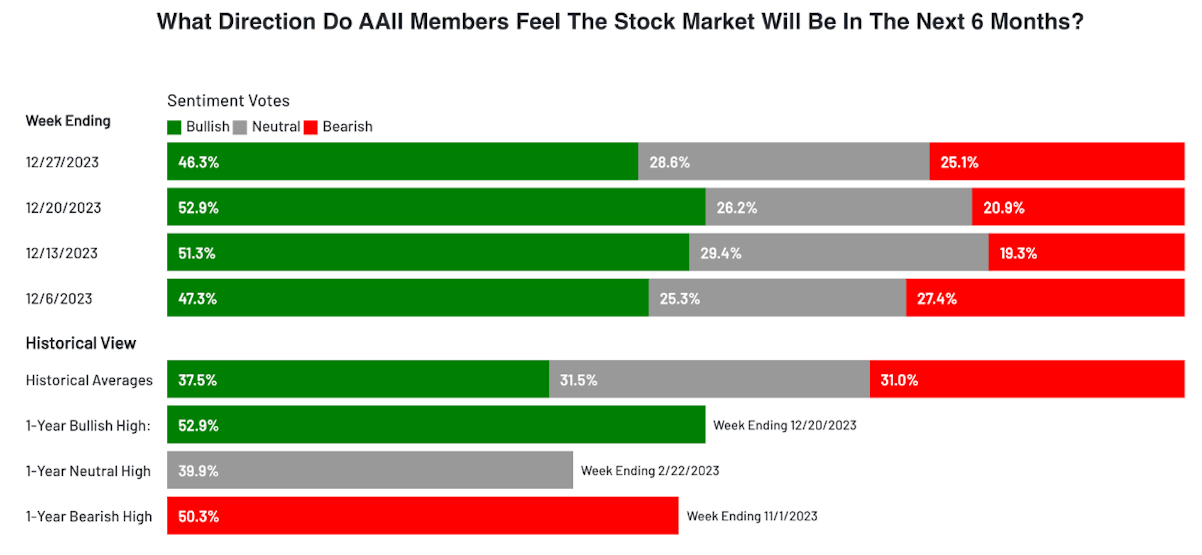
This sentiment shift can be observed in surveys such as the AAII Sentiment Survey, which asks investors their thoughts on where the stock market is heading over the next six months. Two weeks ago, this survey hit a 1-year bullish high and stands well above its historical average.
AAII
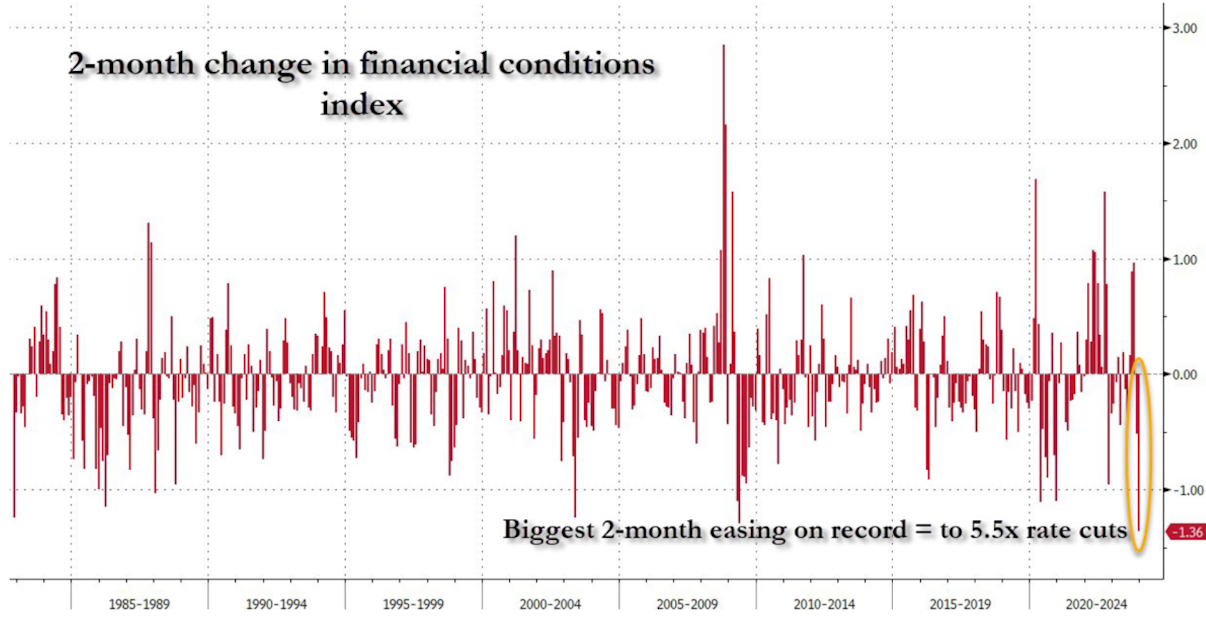
In terms of financial conditions, this has been the biggest two-month easing in history, according to Zerohedge. The index currently sits at levels last seen in May 2022.
Zerohedge
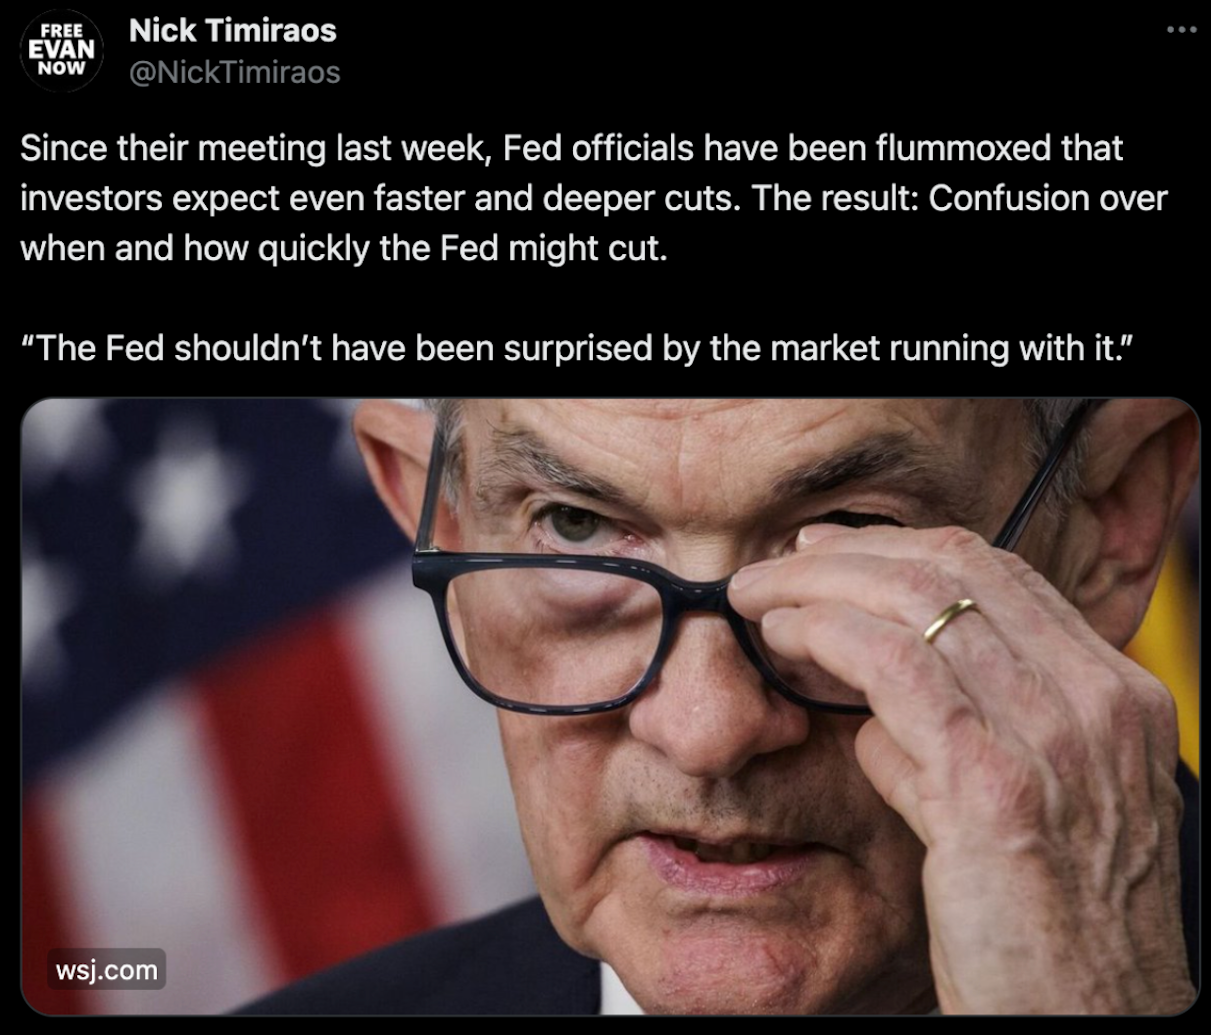
This loosening of financial conditions has surely caught the attention of Fed officials as they appear shocked at the market’s reaction to their dovish messaging. One of the Fed’s favorite mainstream media mouthpieces, the WSJ’s Nick Timiraos, summed it up well in the tweet below.
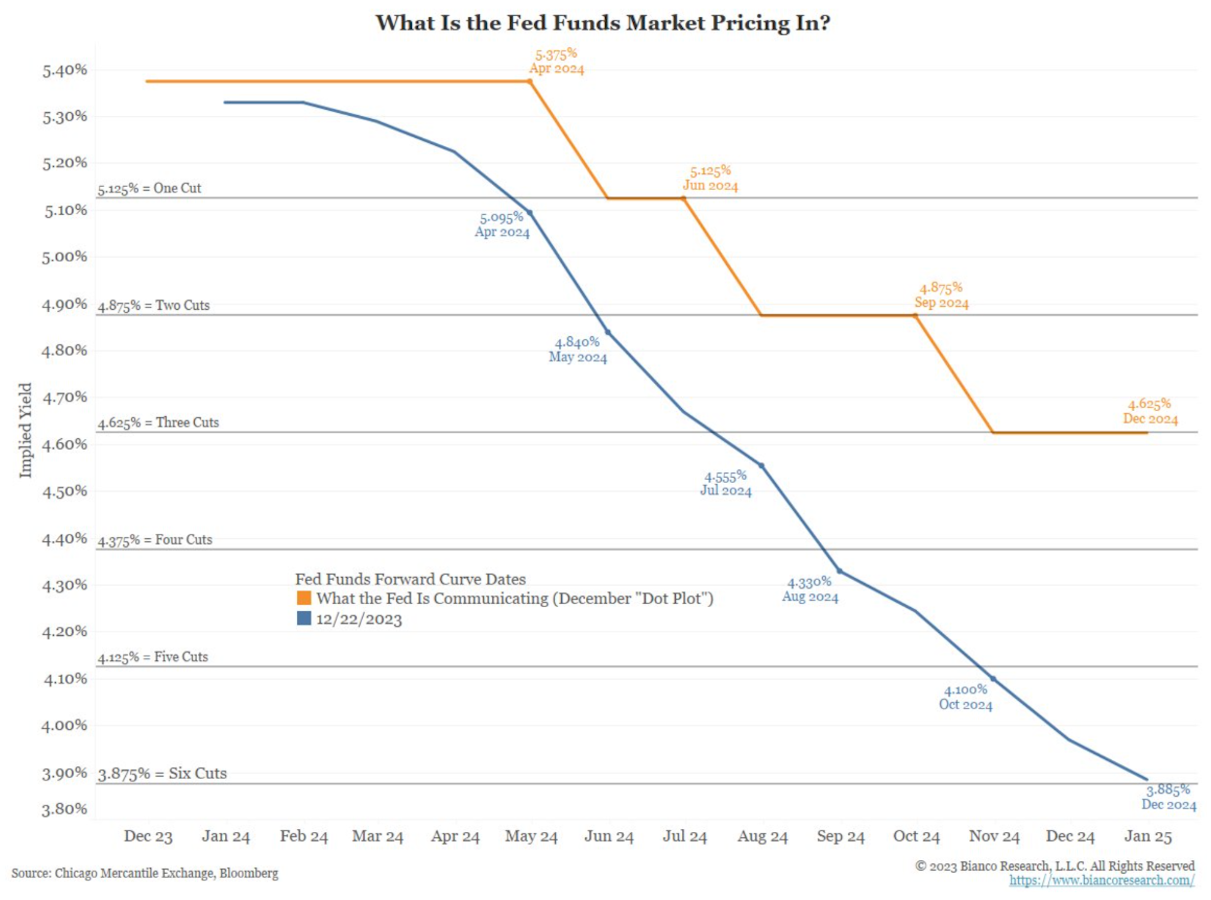
From the FOMC meeting, the Fed’s dot plot showed that Fed officials are expecting three 0.25% rate cuts in 2024, but the market is now pricing in over double that.
Jim Bianco
If the market is correct that we are about to experience a notable shift in monetary policy compared to the last 18 months, then this will have a significant impact on capital flows.
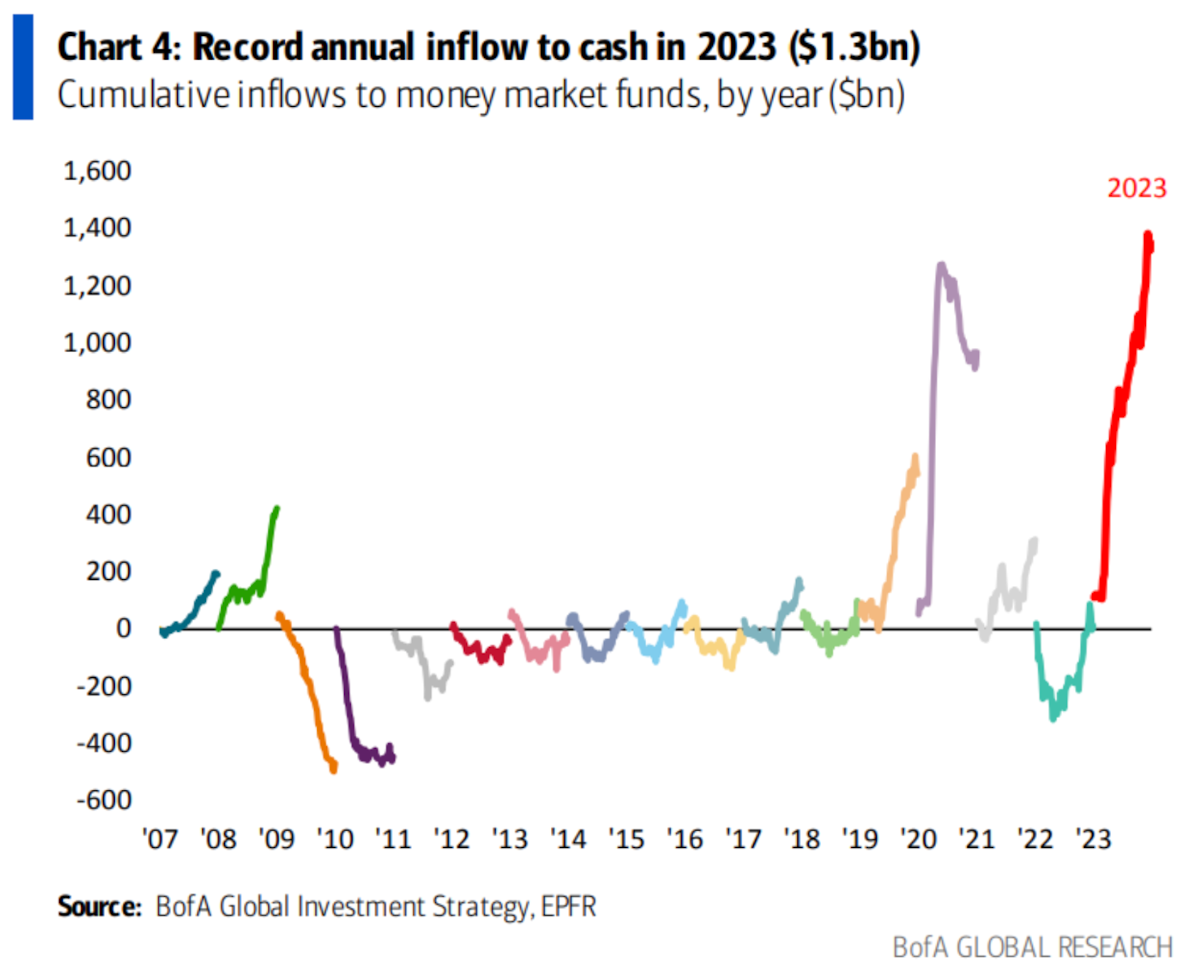
As interest rates soared, investors attracted by higher yields have been funneling capital to money market funds in record amounts. In 2023, money market funds saw a record $1.3 billion in cumulative inflows.
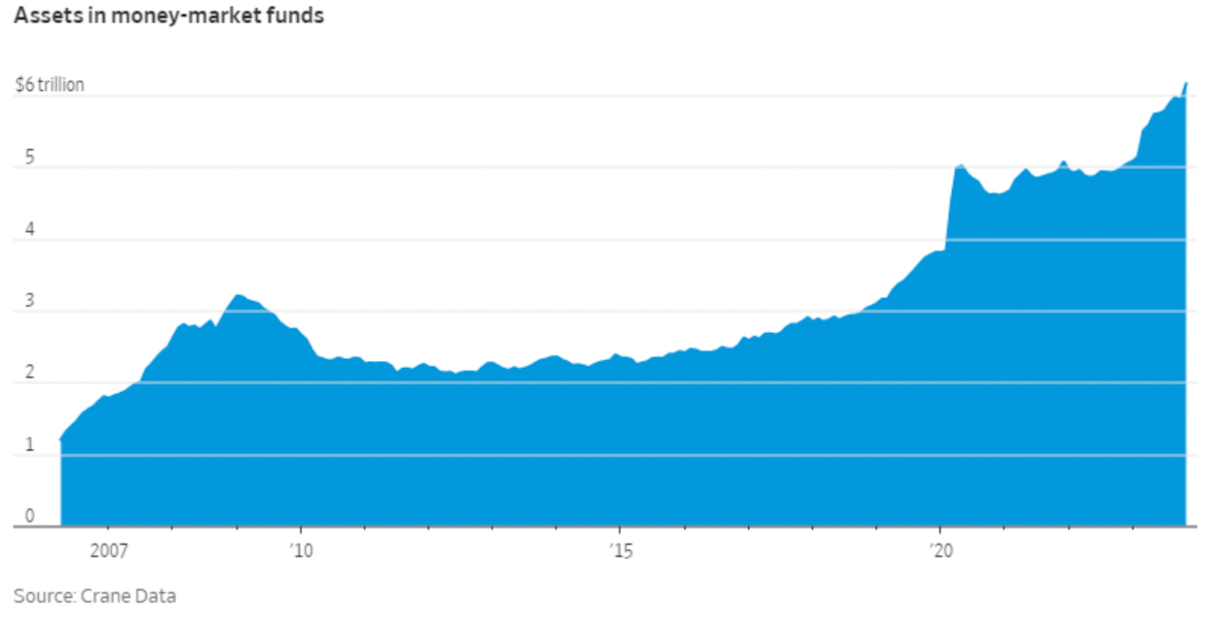
As it stands today, a record high of over $6 trillion is now sitting in money market funds.
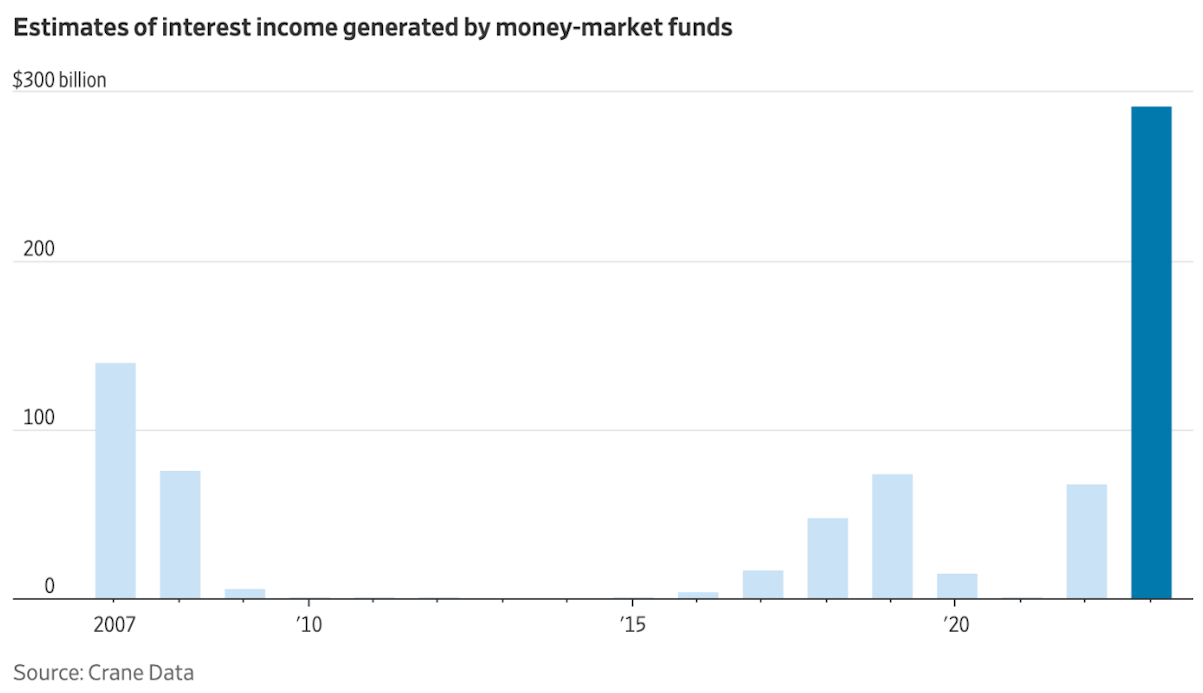
The WSJ reported that, by simply parking their funds in these money market funds, investors brought in nearly $300 billion in passive interest income, more than in the last 10 years combined.
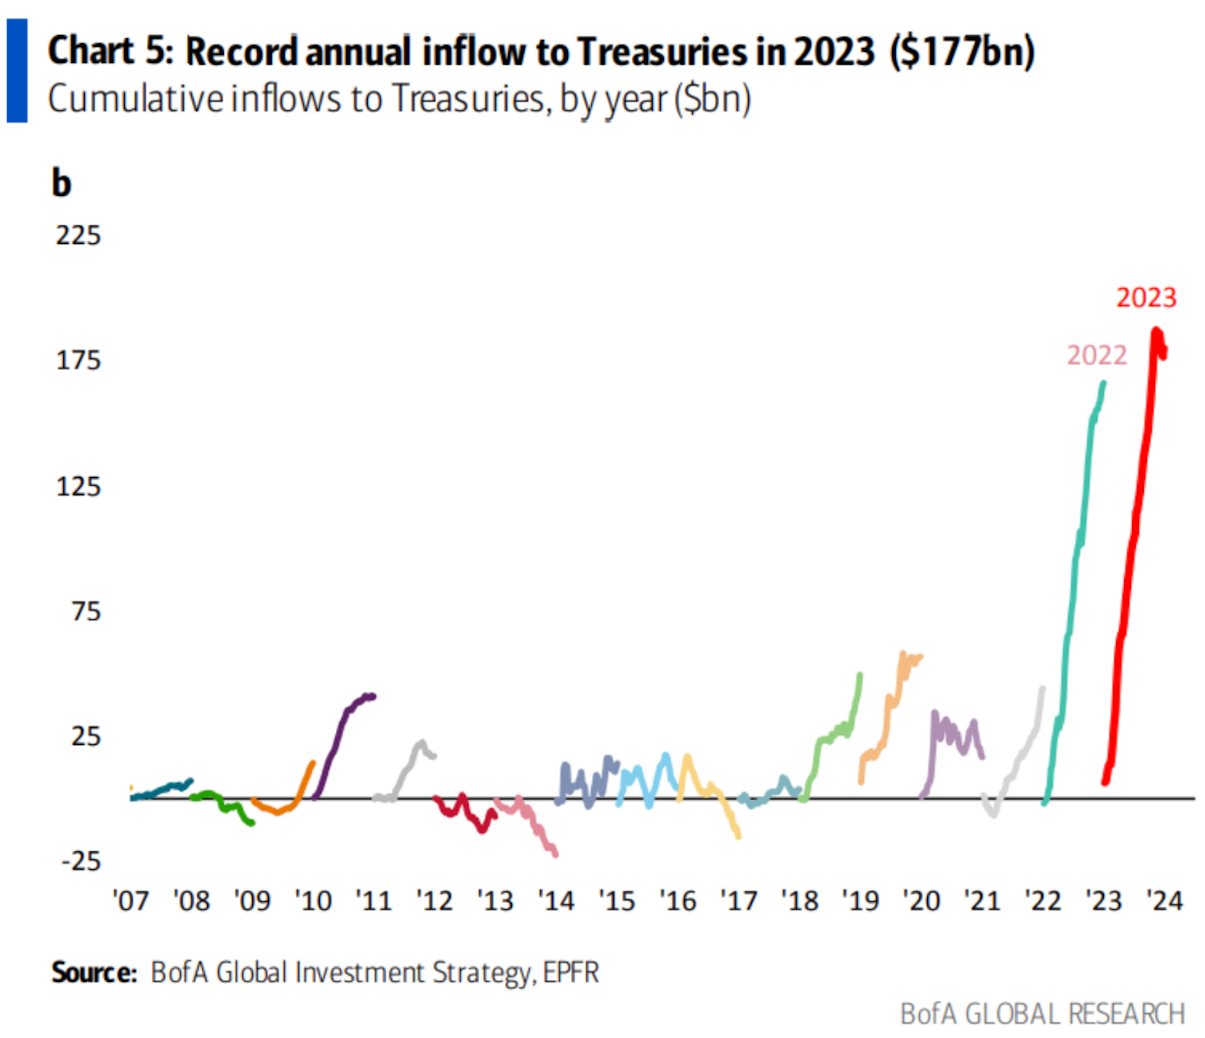
The same kind of demand can be seen in cash-like equivalents like Treasuries. As rates have spiked, so too have inflows into Treasuries. They have seen a record $177 billion in cumulative inflows in 2023. This topped the previous record set just last year.
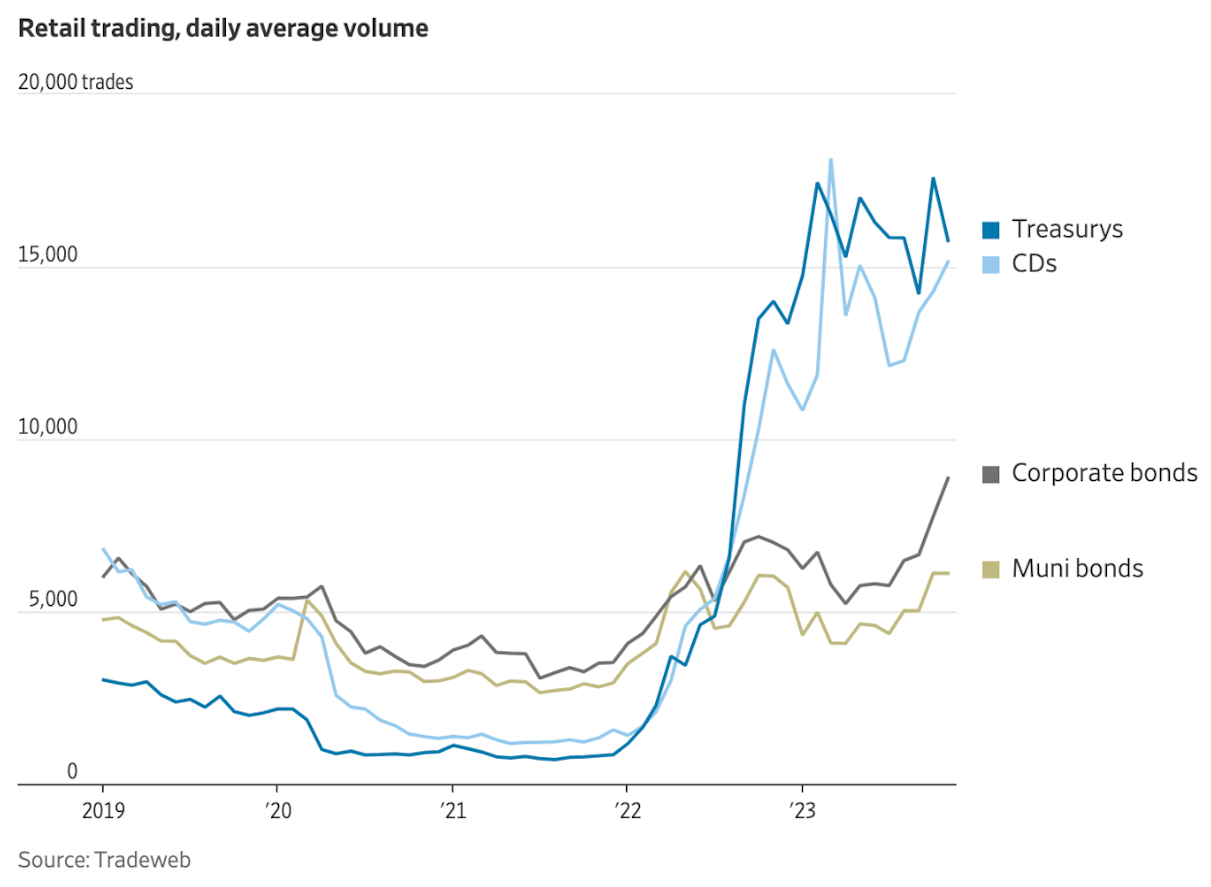
This data is confirmed by broker-dealers on the ground such as Fidelity, which reported that it has seen its retail trading in Treasuries and certificates of deposits (CDs) increase tenfold since the end of 2021. Tradeweb data also recently disclosed that purchases of CDs and Treasuries hit the highest levels since 2015 this year.
The moral of the story — investors have flooded into cash and cash-like equivalents as they captured higher yields in these traditional safe haven assets.
But what happens to this flood into cash if yields decline as the market expects it to over the next 12 months and investors no longer are receiving as much passive income from these investments? Are we about to see a major reversal in fund flows? And how much of this cash will flow from these assets into risk-on assets?
Well, we may be already witnessing this trend reversal unfolding. As rate cuts next year are now being priced in, bonds are up, stocks have rallied, gold has spiked, and Bitcoin has soared. Since Powell’s speech, the Nasdaq has hit a new all-time high, gold has hit a new all-time high, the S&P 500 hit a 52-week high, and Bitcoin hit a 52-week high.
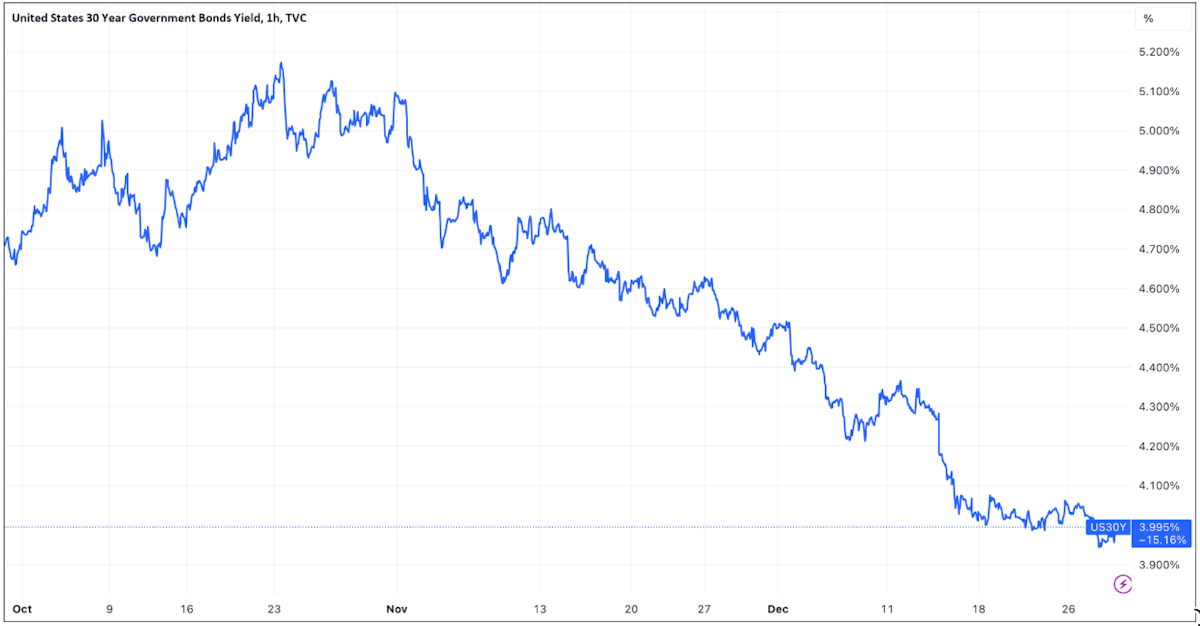
This trend was perhaps most evident in the 30-year Treasury market, where yields have fallen precipitously, down more than 1500 basis points over the last 3 months alone.
Tradingview
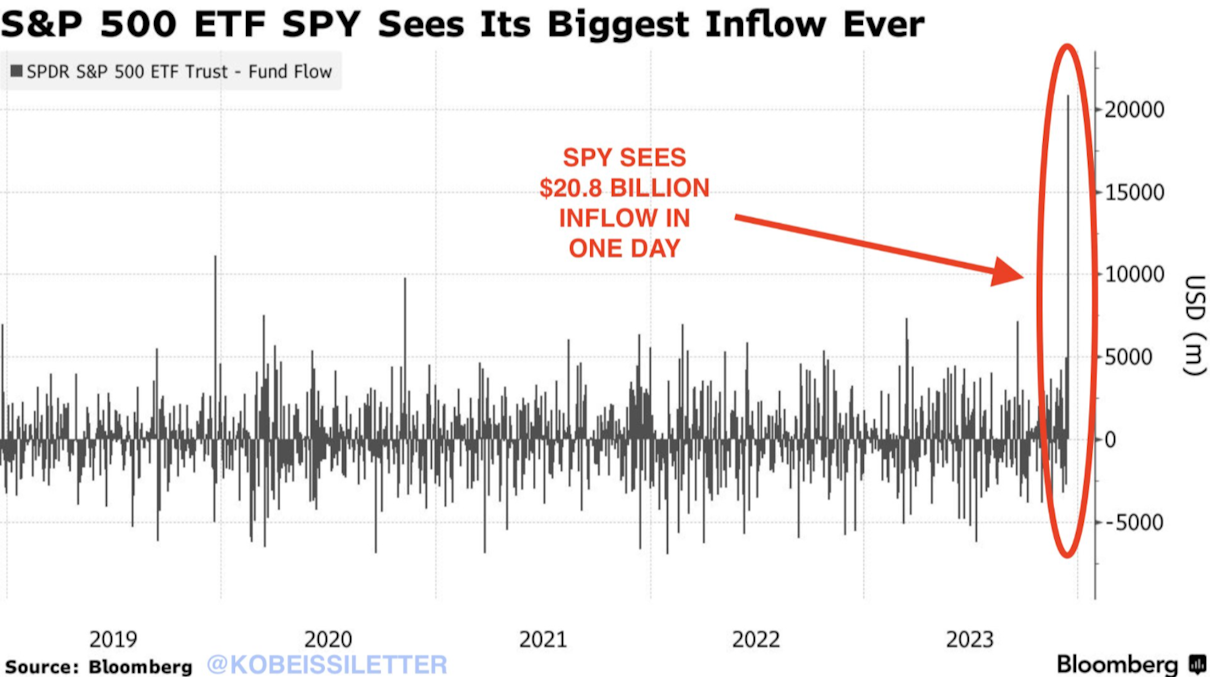
So if investors can no longer get the attractive yields they have enjoyed this year, where will they likely transfer their capital to? Well, stocks are one obvious answer.
This was evident on the days right after the FOMC meeting when SPY saw the single largest one-day inflow in its entire history. A whopping $20.8 billion flooded into the ETF in one trading day.
Another possible destination for this liquidity is Bitcoin, an asset that has outperformed nearly all other assets this year, with the exception of a few tech stocks.
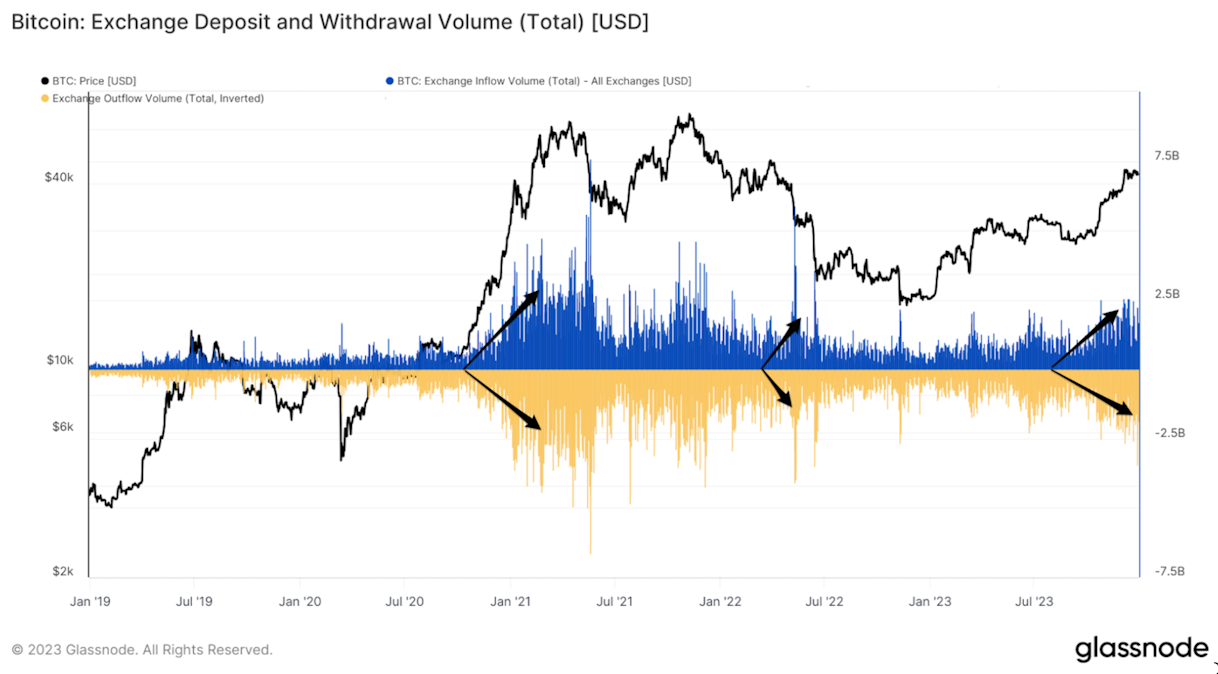
Evidence of the increased demand in Bitcoin can be seen not only in its price but also in the total volume of exchange inflows and outflows. According to Glassnode, these flows have been trending higher over the past 6 months and have recently increased to levels not seen since mid-2022.
Below, the chart illustrates the total volume of deposits and withdrawals across all major exchanges. The blue shows exchange inflows and the gold shows exchange outflows.
As indicated in the chart, the volume of exchange inflows and outflows tends to spike during heightened periods of volatility. These flows increase with both price rises and declines. However, considering we are exiting a bear market where Bitcoin declined -70% from its ATH, along with recent price action, it’s likely these flows are rising due to increased buying activity.
It’s reasonable to think that a fraction of these Bitcoin flows are coming from investors allocating capital away from cash, anticipating yields will fall in the future.
The forthcoming approval of spot Bitcoin ETFs will further boost Bitcoin flows as they will make exposure to Bitcoin more accessible to a range of investors, especially pension funds and RIAs currently restricted by investment mandates from investing in spot Bitcoin.
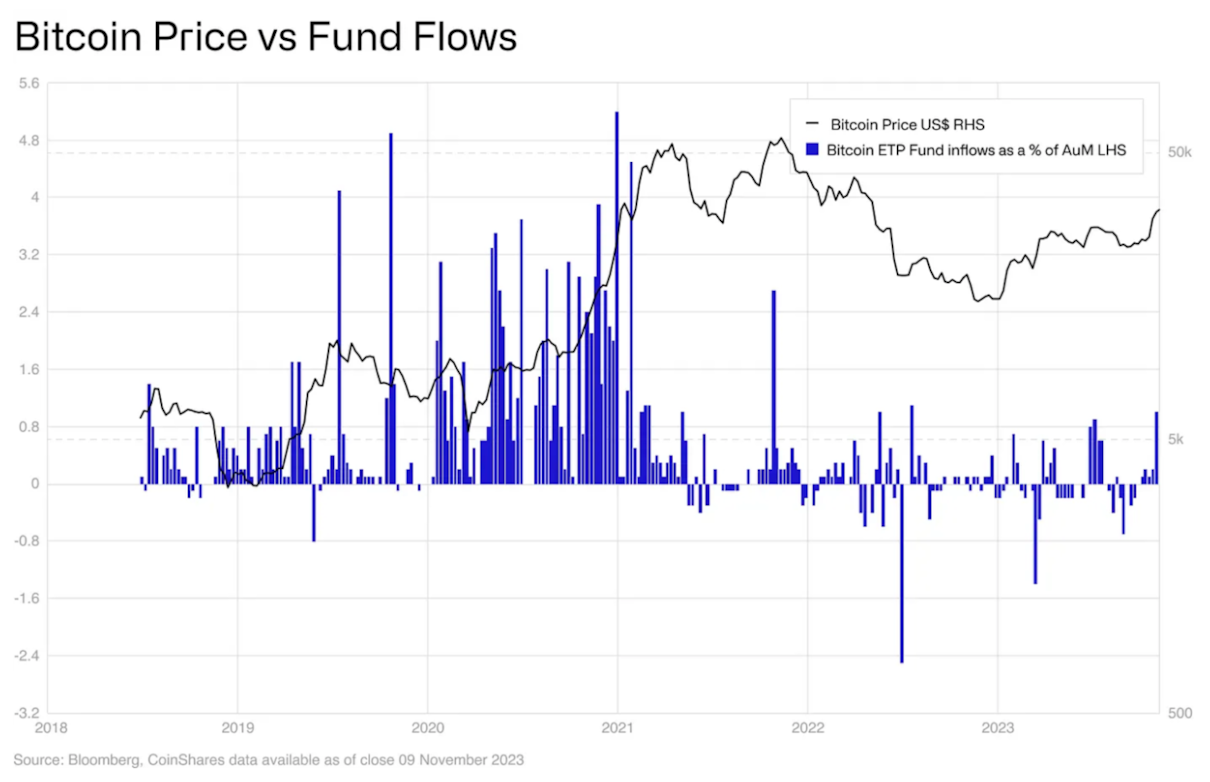
James Butterfill of Coinshares recently attempted to estimate the potential inflows we can expect to see once ETFs are approved and their subsequent impact on Bitcoin’s price. He did this by analyzing the historical relationship between the percentage of inflows into existing Bitcoin ETP products and Bitcoin’s price movements.
He discovered that ETP inflows and Bitcoin’s price often tend to rise concurrently within the same week. that there was a historical relationship between ETP inflows and Bitcoin’s price movements. ETP inflows and Bitcoin’s price tend to rise in the same week, highlighted in the chart below.
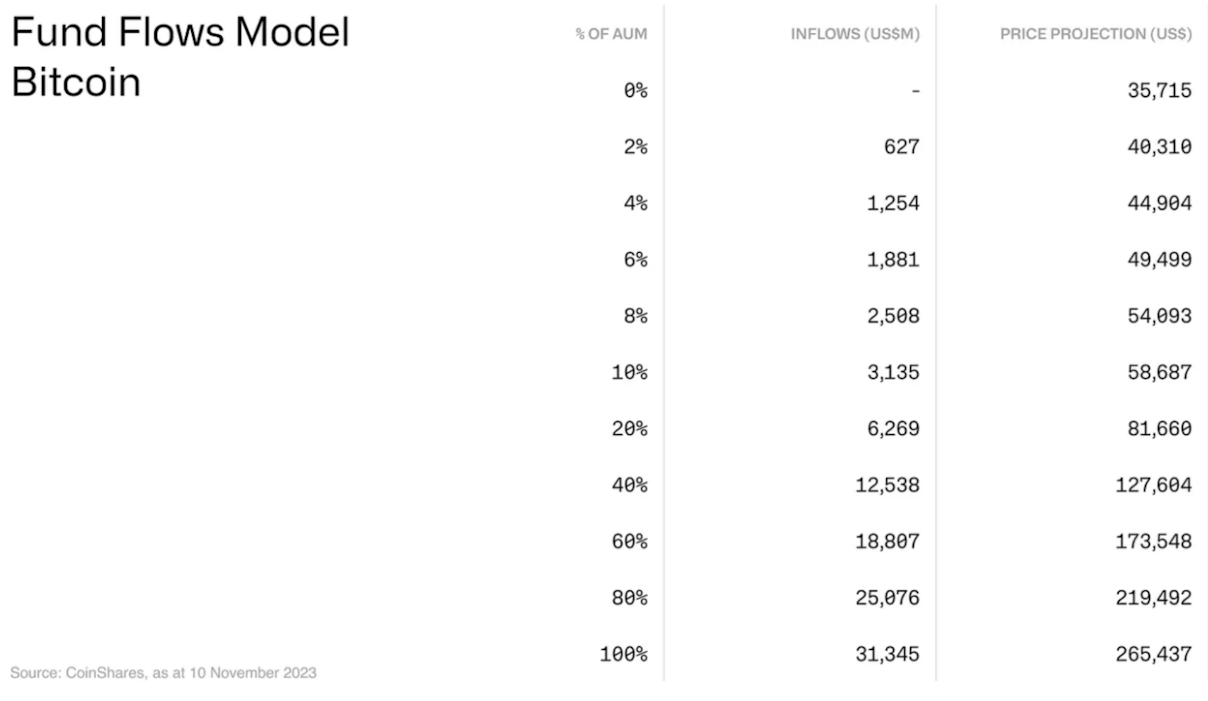
In a recent report, Galaxy estimated that $14.4 billion of inflows could flow into a spot Bitcoin ETF in its first year if 10% of the total addressable assets of broker-dealers, banks, and RIAs allocated 1% to a Bitcoin ETF. By modeling the historical relationship between ETP inflows and price, and then applying Galaxy 1st year inflows estimation, Butterfill came to the conclusion that these inflows could result in a Bitcoin price of $141,000 per bitcoin if they came to fruition.
By modeling the historical relationship between ETP inflows and price and Galaxy’s estimation of 1st-year inflows, Butterfill concluded that these inflows could push Bitcoin’s price to $141,000 if realized.
James Butterfill
And this price would come from inflows just from the ETFs alone! Ultimately, there are many reasons to believe that Bitcoin will continue to see inflows given multiple bullish catalysts such as the coming halving event, the approval of new FASB accounting rules, greater regulatory clarity, and the potential flood of capital that could come from cash if the Fed does turn to cutting interest rates in 2024.
Over the last two years, investors have taken advantage of an investing environment that they have not known after more than a decade of low interest rates. They finally were able to earn a decent yield in Treasuries and money market funds which resulted in capital being sucked out of assets perceived as more risky. But now it appears the tide is turning. If the Fed decides to cut rates then expect the floodgates to open, and Bitcoin will be one beneficiary as it sucks up the liquidity, potentially driving its price to new heights in the coming year.
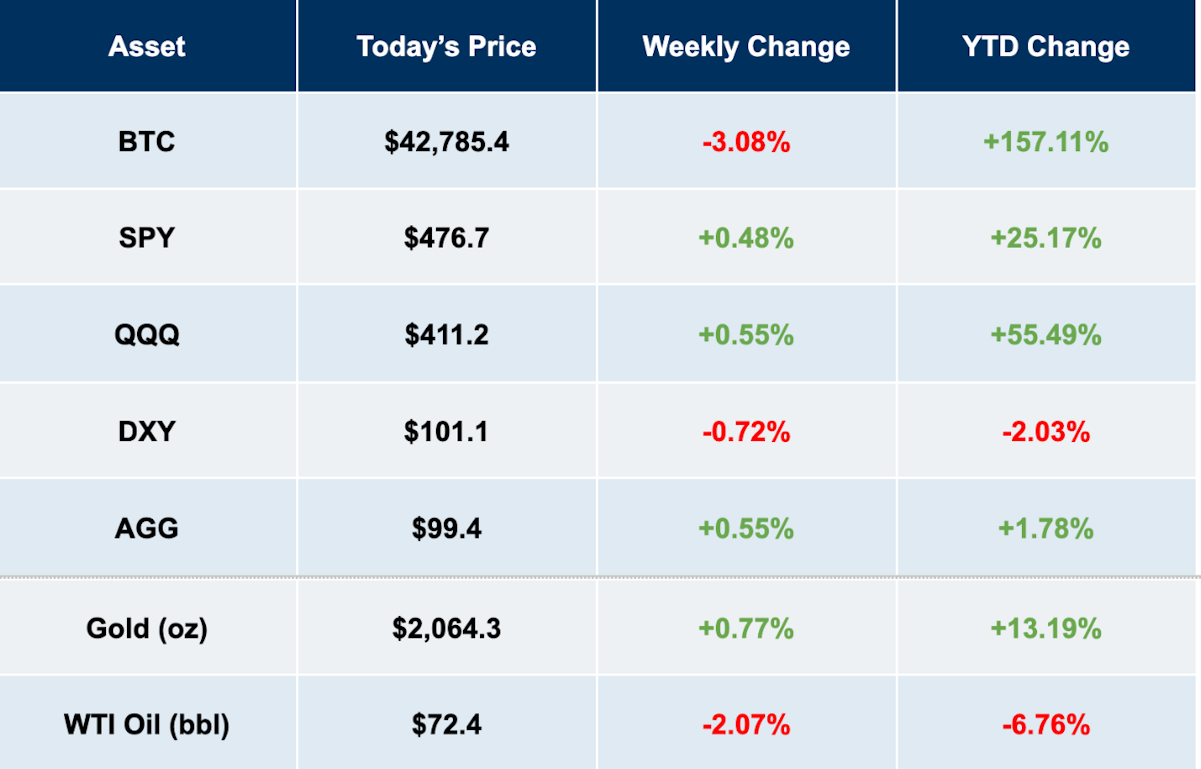
Market Overview
Tradingview, Prices as of 12/29/23
Hold your IRA with the most trusted name in Bitcoin.
Sam Callahan is the Lead Analyst at Swan Bitcoin. He graduated from Indiana University with degrees in Biology and Physics before turning his attention towards the markets. He writes the popular “Running the Numbers” section in the monthly Swan Private Insight Report. Sam’s analysis is frequently shared across social media, and he’s been a guest on popular podcasts such as The Investor’s Podcast and the Stephan Livera Podcast.
News
More NewsThoughts on Bitcoin from the Swan team and friends.
Is Bitcoin safe for generational wealth? Learn why custody, inheritance planning, and patience matter more than price when building lasting family wealth with Bitcoin.
Bitcoin estate planning is the most under-addressed risk in HNW portfolios. Why holders and their CPAs, attorneys, and trustees keep missing it, and how to close the gap.
Learn how Bitcoin wealth management works, from custody and security to inheritance planning and liquidity. Discover how families and businesses use Bitcoin to build and protect long-term wealth.